It is certainly true that the Australian Labor Party has a more ambitious climate policy than the federal Coalition, but that increased ambition doesn’t move many dials.
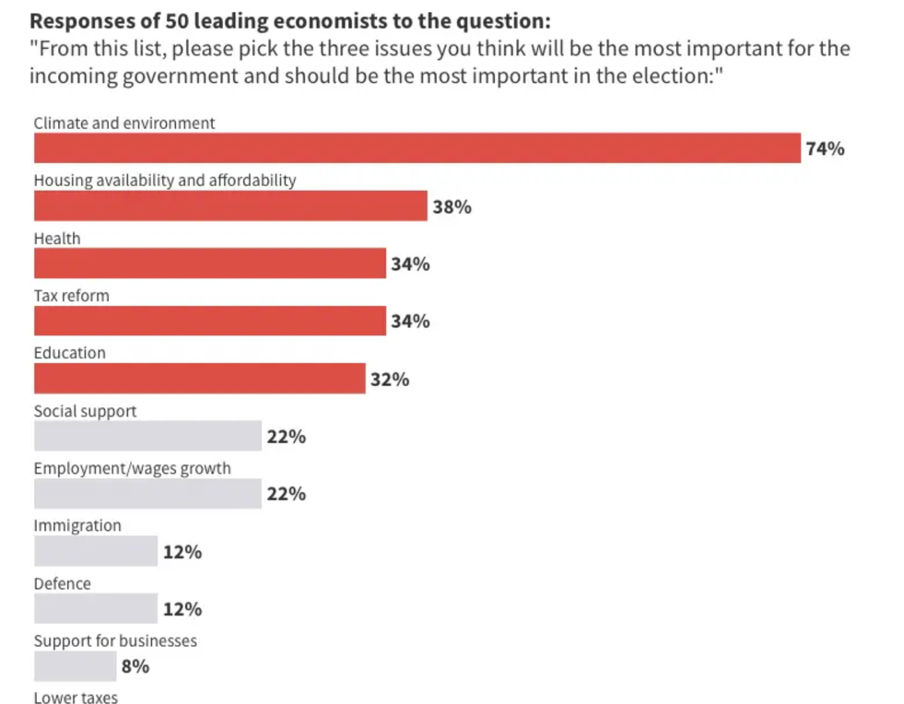
Economists consider global warming and the environment to be the number 1 issue in the election, yet this election is being mostly fought over the cost of living, defence, and the character traits of the Prime Minister and the Leader of the Opposition.
How stupid economists must be.
The cost of living is going up largely because of increased energy prices. And why are energy prices going up? Because of Russia and the fact that no one wants to invest in coal, oil or gas other than the business people whose careers depend on those industries.
Nearly everyone with a brain will see that Europe will, in time, accelerate its decarbonisation as a result of Russian aggression.
But that is all basically short term stuff. Meanwhile, the world is literally cooking itself.
The following chart shows global annual primary energy production in 2020. It will have been higher in 2021. The scale is zetajoules. 1 zetajoule = 1,000,000 petajoules. For perspective Australia produces say 75 mt of LNG which is a bit over 4000 PJ of energy.

If added up all that primary energy production across the whole world its 0.55 zetajoules or 550,000 petajoules.
The following chart compares that amount of energy produced every year with the annual increase in ocean heat of about 10 zetajoules.
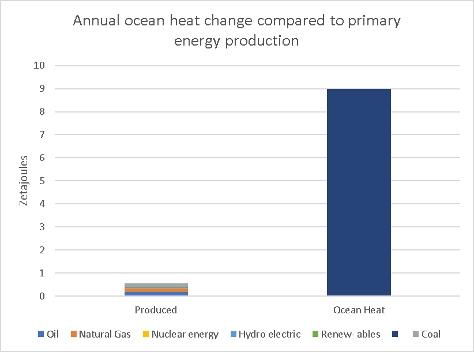
In short, the world puts about 18-20 times as much heat into the oceans each year as we produce from primary energy.
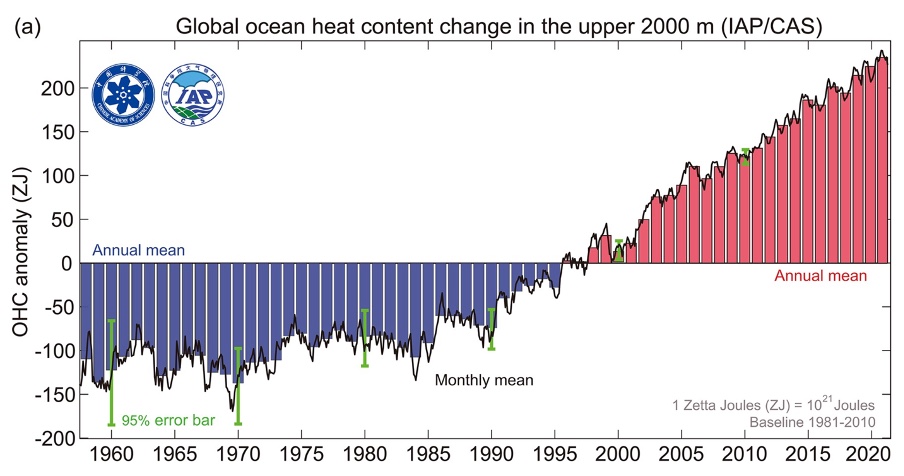
And the annual increase in ocean heat is accelerating:
In careful scientific language, written by a group of the world’s leading climate scientists:
“The up-to-date data indicate that the OHC in the upper 2000 m layer of the world’s oceans has increased with a mean rate of 5.7 ± 1.0 ZJ yr–1 for the 1958–2021 period (IAP/CAS) and 4.7 ± 1.0 ZJ yr–1 for the 1958–2021 period (NCEI/NOAA) (Fig. 1a). Both datasets show an unambiguous increase in ocean warming since the late 1980s (Fig. 1a). From 1986–2021, the average annual increase is 9.1 ± 0.3 ZJ yr–1 for IAP and 8.3 ± 0.7 ZJ yr–1 for NCEI/NOAA. These warming rates represent a maximum of 8-fold increase compared to 1958–85 (1.2 ± 0.6 ZJ yr–1 IAP/CAS, 1.5 ± 1.0 ZJ yr–1 for NCEI/NOAA). Moreover, each decade since 1958 has been warmer than the preceding decades.
The 2021 annual OHC value is higher than the last year’s value, by 14 ± 11 ZJ using the IAP/CAS data and by 16 ± 10 ZJ using NCEI/NOAA (95% confidence interval). “
Total ocean heat to a 2000 metre depth has increased by 200 ZJ and is growing therefore about 5% a year.
Think about it.
Yet neither major political party can even be bothered with vehicle emissions standards, let alone a policy that might actually change consumer behaviour. Utterly hopeless.