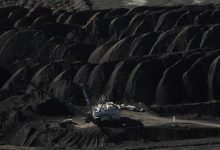
In Australian dollar terms, the Newcastle coal price was around A$160 a tonne in December, 2018, and it’s now around $100/t, and the decline has accelerated in the past month.
Around the turn of the year the chatter put the blame on declining demand in Europe, but by and large for Australia the vast majority of thermal coal goes to Asia – Japan and China being two of the largest customers.
We have long said that China cannot afford to keep paying over US$100/t for thermal coal, because it’s a big negative for its energy intensive, globally dominant, manufacturing sector such as steel, cement, chemicals and all the stuff that needs raw materials from Australia.
May data for electricity and coal production in China is not yet available, but it’s unlikely that a fall in either Chinese or Indian demand is responsible for the latest price fall. The most likely explanation is an increase in supply, particularly of low quality Indonesian coal but also US coal seeking a non European home, South African coal and indeed increased exports from Australia.
The decline should put some modest downward pressure on electricity prices in Australian main grid (the NEM) but it’s really thinking about whether the price is yet low enough for generators to want to write longer term contracts, ie for 2022-2028. In US$ terms prices are now about 10% below 5 year average but right on the average in A$ terms.


Time for some advertising in Queensland by a Queenslander?
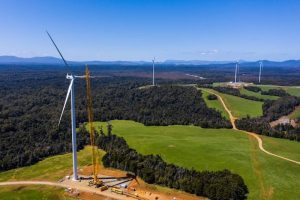
At present the renewable energy industry is losing the fight in Queensland.
The state government, which seems to be comprised of some renewable energy supporters and increasing numbers of union types, seems to have forgotten it was South East Queensland that won them the last State election and it is moving the dial to the “who gives a stuff about climate change and the future”.
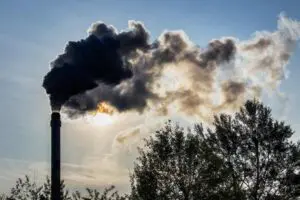
There is no question whatsoever that facts support climate change activism, just look at flood and drought damage in Queensland and that equally firmed up renewable energy is cheaper than new coal.
However, facts aren’t going to win the votes, at least not unless they are framed appropriately. Emotions are going to win votes. And by the way it’s not LNP v ALP but climate change v coal mining that is the issue, and renewable energy v thermal energy.
Perhaps the renewable energy and the climate change industry could get together to start framing the emotional messages?
This would be the Clean Energy Council, the Smart Energy Council, the Climate Council and numerous other organisations. Senior people from these organization need to talk to each other, then hire a marketing/advertising person so that the issues can be framed in the appropriate way for Queenslanders.
There’s been too much lobbying from people who aren’t skilled at crafting the correct emotional messages and not enough clever marketing. The rise of climate focused non green candidates in LNP-centric NSW and Victorian electorates, not to mention Zali Steggall’s win over Tony Abbott, shows there is success to be had.
This needs to be transferred into Queensland. Like Steggall taught us in Warringah, Queensland needs a Queenslander as champion, a Queensland marketer.
Time is short, the world is being killed, partly by Queensland coal exports and lack of action on the notional Qld 50% renewable target.
The market action
Volumes were particularly soft in the past week, one suspects due to warmer weather than last year. This lead to spot prices falling from the prior week but still above a year ago. Really despite the outage at Loy Yang A it was a slow old week.

Figure 3 NEM summary. Source: NEM Review, ASX, Mercaria, AEMO

Generation by fuel
We’ve previously drawn attention to the reduction in hydro but this week the key feature is the fall over the last 30 days of Victorian coal generation compared to PCP down an annualized 8 TWh with a lift in the VRE share from 10% to 15%.


Volumes
Very soft consumption driven by a slow start to Winter.

Baseload futures, $MWH
Futures prices were little impacted by the election.


Gas Prices