When is a plan not a plan?
When it comes to transmission, the Australian Energy Market Operator – with the help of the Energy Security Board – has been able turn its plan into action in the sense that some new transmission is likely to be built, albeit too little and too slowly and with many, many process obstacles to overcome.
New transmission identified as urgent in its Integrated System Plan is going to get built because it’s regulated. Essentially, someone makes an executive decision that the new transmission is required, achieves agreement and gets regulated revenue.
When it comes to generation, however, neither AEMO nor the ESB has any influence whatsoever. There is no carbon imperative, there is nothing other than the market and some state mandates in Victoria and Queensland.
As such, where generation is concerned the ISP is better regarded not so much as a plan but a forecast. It becomes an actionable plan only if there is a reliability issue and even then it’s not the ISP that drives that decision.
Coal generators may close early or later than forecast, new gas might be built etc. Even so what we can learn from the scenarios included in the ISP is what AEMO thinks it will take in the way of new storage for a forecast level of coal and gas retirements and that is the focus of this brief note.
In addition in view of all the recent negative comment around Snowy we look very briefly at what the market may have overlooked on the positive side.
The art of interpreting a graph
In December this year we will get a preliminary view of the 2020 ISP. Results of the early modelling that underlies this can be found 2020 ISP preliminary modelling outcome presentation. Reneweconomy has already written this up, see AEMO provides glimpse of future grid: Not much fossil fuel, even less “base-load”
Here, I want to focus on one graph.

There is a tonne of information in this graph but, like a painting I saw 21 years ago in the Hong Kong Museum of Art, which depicted birds taking off by showing only the ripples in the water and not the birds themselves, much is left to imagination and interpretation. And, like the painting, I suspect this is by design.
So, like Salome dancing for King Herrod, let’s remove a couple of the veils to reveal the underlying pictures more explicitly.
Step 1 is to convert the graph to a table. In doing this we translate the “forecast development need” as demand and the “existing & committed” as supply. The difference is the excess supply or required new build.

I was mainly interested in AEMO’s estimate of how much storage was going to be required and more focused on 2030 than 2040. The table shows that AEMO believes the reliability standard can be met, even with 5 GW of coal retirements and 1 GW of gas retirements with less than 3 GW of new storage. In the table Snowy 2.0 is treated as committed and therefore its 2GW of additional storage is included.
Still, the graph doesn’t show anything about the required duration of the storage.
By and large the message of the chart is that AEMO’s modelling suggests that about 1GW of new storage is required for every 1GW of thermal that retires, at least until 2040. As the share of VRE increases, the storage ratio required also increases despite VRE portfolio diversification benefits.

A final observation is that to 2030 only a further 9GW of VRE are required, that’s less than 1 GW per year and way less than what the industry can and would like to deliver if the transmission and the incentive was there. That pace of build implies a sharp employment contraction in the new build industry.
In ITK’s view a national carbon policy could move us down this path faster. Our estimate is that another 9GW of VRE will not get us much over 40% renewables NEM wide by 2030 when over 50% is required if Australia is to do its bit to keep global warming under 2C.
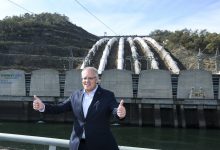
Blinded by snow – Snowy 2.0 was never intended to pump 350 GWh every day
Despite the publicity which Bruce Mountain’s analysis of Snowy 2.0 has attracted I would argue that the issue about the mismatch between the power of the project 2000 MW and its capacity 350 GWh has been know from day 1. Here at ITK we wrote about it for Reneweconomy back in December 2017.
What I’ve learned in the two years since then, and I’ve had two meetings with Snowy management over that time, is that Snowy never intended to make a return on capital in the daily balancing market.
That’s the mode of operation when you generate every day in the early morning and evening peak and replenish the dam during the middle of the day when the electricity price is low. Since 2017 it’s been easy to see that you would need well over $100 MWh difference between the price paid for power and the price you can sell at to get a return on capital.
It turns out that’s not how Snowy plans to make money.
Energy Insiders had an extensive interview with Gordon Wymer from Snowy not so long ago. He stated in that interview that Snowy intended to operate on a seasonal basis, after the Snowy team had modelled the future opportunity over two years.
This means lots of the pumping might be done in the September quarter when, as we have just seen, demand is weak and prices in the middle of the day may be low or negative for long periods.
Then, assuming the transmission was there, the station can deliver output in the March quarter when prices are consistently high and the power is most needed.
Wymer specifically said that Snowy was unlikely to operate, as a matter of course, in the daily balancing market. Much, much less storage, really only 4-6 hours is needed in the daily market. So in ITK’s view you have to assess Snowy 2’s economics based on the way its designed to operate.
For what its worth we still think Snowy may struggle to earn a decent return but it is good long term seasonal insurance in the NEM.
If you want to focus on a real Government colossal waste of money and something that definitely will impact every Australian’s tax bill, take a look at the Australian submarine project. As a reminder the 12 new subs are forecast to cost $50 bn before over runs and will be delivered between 2036 (at the earliest) and about 2050.
Another important point is that viewed as a seasonal operator it doesn’t crowd out private investment in the daily balancing market and still less in the five minute balancing market.
In the five minute market round trip efficiency will be important and that is not Snowy’s strength. So there will still be room for Origin’s Shoalhaven project or one of the South Australian projects likely to be supported by ARENA and UNGI and announced by Xmas, as revealed by Darren Miller, CEO ARENA on yet another Energy Insiders podcast.
Secondly and harder to analyse, Snowy 2.0 can be viewed outside of its spot market operation as part of a portfolio of firmed products.
This is a financial concept really where Snowy has contracted 800 MW of VRE and can use Snowy 2, as well as its existing resources to turn that into firm electricity, not 800 MW of firm but more like 300 – 400 MW of firm power. This is similar to what say Infigen is doing with its gas generation.

