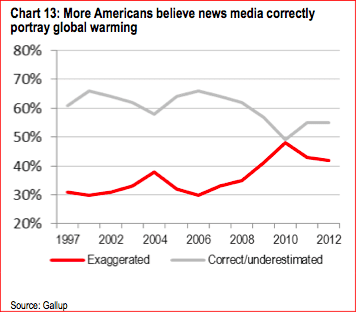
Economists at HSBC have produced another excellent analysis on climate change challenges, policies and business case, which we have reported on here. And we’ve drawn from that report to produce today’s Graph of the Day.
This comes from a Gallup poll on US attitudes to global warming. It suggests that late 2009, early 2010 may have been the peak in climate denial, at least regards the science. That coincides with the failure of the Copenhagen climate conference, and though this reflects American attitudes, Australia had pretty much fallen into lockstep with the US, and that time frame just happens to coincide with Turnbull’s unseating by Tony Abbott, the abandonment of bipartisan support for the carbon price, Keven Rudd’s dropping of the Carbon Pollution Reduction Scheme, and his overthrow by those who reportedly forced that decision upon him, Julia Gillard and Wayne Swan, and of Gillard’s proposal for a “people’ assembly” (remember that?).
Importantly, this graph precedes Hurricane Sandy, and of course the recent deep freeze in Europe and elsewhere in the northern Hemisphere, an event that is being ascribed to the depletion of Arctic sea ice.