The Victoria Energy Policy Centre (VEPC) has just deployed Version 1.0 of a National Energy Market (NEM) Data Dashboard, which is accessible at nemdashboard.com.au.
This is a free-to-use data portal with numerous pre-programmed NEM data visualisations. The dashboard implements data tools developed as part of the VEPC research program, into an easy-to-use interface to visualise and download historical NEM data from 2012 to the present.
This tool is primarily a historic data analytical and data visualisation tool, it does not provide up to the minute market data.
We expect that, like us, market analysts, regulatory staff, policy advisors and academic researchers will find the dashboard to be a valuable tool in their work.
The NEM dashboard consists of four tabs:
- Regional NEM – which provides demand, price and fuel-type production data for each NEM region.
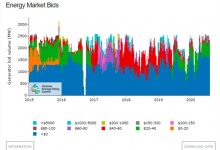
- NEM Generators –this tab shows dispatch, capacity factor, market bids, price setting frequency, and volume weighted average price for each generator in the Australian National Energy Market.
- Renewable summary – this covers renewable data for each NEM region such as renewable production, percentage of demand and volume weighted average price.
- Interconnectors – which visualises the average power flow between NEM regions.
The controls on each dashboard tab allow the visualisation and download of data at 30-minute, daily, monthly or yearly intervals. An information button below each chart provides a description of the visualisation/data and the data sources.
The dashboard is already getting traffic from around Australia and VEPC researchers have used the dashboard extensively to answer questions such as:
- What were the prices and volumes on interconnector flows on the Tasmania to Victoria interconnector?
- What is the energy production mix in New South Wales and how has this changed since 2012?
- How does the offer price stack for Bayswater compare to Tallawara power station?
- How have prices changed when averaged over various durations in each NEM region since 2012?
Of course there are thousands more questions that this portal can quickly answer. What would you like to know?
Take a look at the site and please provide your feedback to us, via the site, if you wish. Bookmark the page and tell your friends about it.
We are also running a webinar on how to use the dashboard, on Wednesday October, 28. Please register for it here if you would like to attend.
Reneweconomy.com.au will include a URL link to the site for easy access via Reneweconomy, in due course.
Dr. Steven Percy and Bruce Mountain are senior analysts at the Victoria Energy Policy Centre.