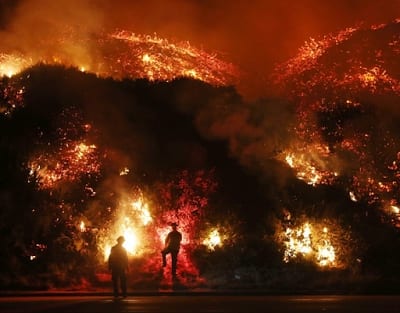

Much of what happened in 2017 was predictable: news of climate extremes became, how can I put it … almost the norm. There was record-breaking heat on several continents, California’s biggest wildfire (extraordinarily in the middle of winter), an ex-tropical cyclone hitting Ireland (yes, Ireland) in October, and the unprecedented Hurricanes Harvey, Irma and Maria that swept through the Atlantic in August. The US government agency, the NOAA, reported that there were 16 catastrophic billion-dollar weather/climate events in the USA during 2017.
And 2017 “marks the first time some of the (scientific) papers concluded that an event could not have occurred — like, at all — in a world where global warming did not exist. The studies suggested that the record-breaking global temperatures in 2016, an extreme heat wave in Asia and a patch of unusually warm water in the Alaskan Gulf were only possible because of human-caused climate change”, Reuters reported.
She said that most cryosphere thresholds are determined by peak temperature, and the length of time spent at that peak, warning that “later, decreasing temperatures after the peak are largely irrelevant, especially with higher temperatures and longer duration peaks”. Thus “overshoot scenarios”, which are now becoming the norm in policy-making circles (including all 1.5°C scenarios) hold much greater risks.
As well, Pearson said that 2100 is a misleading and minimising measure of cryosphere response: “When setting goals, it is important to look to new irreversible impacts and the steady state circumstances. The end of the century is too soon to show that before but inevitable response especially for sea level rises.”
Pearson added that: “What keeps cryosphere scientists up at night are irreversible thresholds, particularly West Antarctica and Greenland. The consensus figure for the irreversible melting of Greenland is at 1.6°C.”
So what did we learn about the climate system in 2017? Here’s three that stand out, that should send shivers down the spines of policy makers.
1. 2017 was the second hottest year on record and the hottest non-El Nino year on record
Whilst not all sources have yet released data on annual warming for last year, the Copernicus Climate Change Service, the first major international weather agency to report global 2017 temperatures, said they averaged 1.2°C above pre-industrial times. 2017 was slightly cooler than the warmest year on record, 2016, and warmer than the previous second warmest year, 2015, Reuters reported.
Other organisations have unofficial figures which either agree with this assessment, or say that 2017 has tied with 2015. And last year was Australia’s third-warmest year on record.
It is no surprise that the last three years have been the hottest on the instrumental record. What is remarkable is that 2017 was as hot, or hotter than 2015, because 2015 and 2016 were both El Nino years, and the evidence shows that El Nino years are, on average, about 0.15°C warmer than La Nina years.
In fact, a remarkably hot 2017 crushed the old record for hottest non-El Niño year (2014) by an astounding 0.17°C.
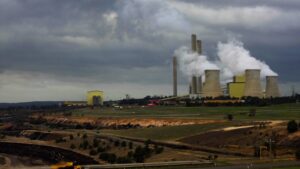
The underlying temperature trend is being driven by continuing high levels of climate pollution: The UN says carbon dioxide levels grew at record pace in 2016. The atmospheric carbon dioxide averaged 403.3 parts per million (ppm) over the year, up from 400 ppm in 2015. The growth rate was 50 percent faster than the average over the past decade.
And global carbon emissions are headed up again after three years in which human-caused emissions appeared to be levelling off. A two percent increase is projected overall, with the highest rise coming in China, according to new research presented at the climate talks in Bonn.
In 2017 we also learned that there was no pause in global warming: the so-called ’slow down’ in climate change between 1998 and 2012 was caused by a lack of data from the Arctic.
2. It is likely to get hotter than we think
Two significant pieces of work released towards the end of 2017 suggest that warming is likely to be greater than the projections of the Intergovernmental Panel on Climate Change (IPCC), on which climate policy-making and carbon budgets are generally based.
This is because what is called Equilibrium Climate Sensitivity (ECS), an estimate of how much the planet will warm for a doubling in the level of greenhouse gases, is higher than the median of the IPCC’s modelling analysis.
In “Greater future global warming inferred from Earth’s recent energy budget” published in Nature in December 2017, Brown and Caldeira compared the performance of a wide range of climate models (raw model projections) with recent observations (especially on the balance of incoming and outgoing top-of-the-atmosphere radiation that ultimately determines the Earth’s temperature), in order to assess which models perform best.
The models that best capture current conditions (the “observationally-informed” models) produce 15% more warming by 2100 than the IPCC suggests, hence reducing the “carbon budget” by around 15% for the 2C target.
For example, they find the warming associated by the IPCC with RCP 4.5 emissions scenario would in fact “follow the trajectory previously associated with (higher emissions) RCP 6.0” scenario.
They also find that the observationally-informed ECS prediction has a mean value of 3.7°C (for a doubling of the atmospheric greenhouse gas level), compared to 3.1°C used in raw models, and in the carbon budget analyses widely used by the IPCC, the UN and at climate policy conferences.
In “Well below 2C: Mitigation strategies for avoiding dangerous to catastrophic climate changes”, published in September 2017, Xu and Ramanathan look at what are called the “fat tail” risks. These are the low-probability, high-impact (LPHI) consequences (“fat tails”) of future emission scenarios; that is, events with a 5% probability at the top end of the range of possible outcomes.
These “top end” risks are more likely to occur than we think, so “it is important to use high-end climate sensitivity because some studies have suggested that 3D climate models have underestimated three major positive climate feedbacks: positive ice albedo feedback from the retreat of Arctic sea ice, positive cloud albedo feedback from retreating storm track clouds in mid-latitudes, and positive albedo feedback by the mixed-phase (water and ice) clouds.”
When these are taken into account, the researchers find that the ECS is more than 40% higher than the IPCC mid-figure, at 4.5-4.7°C. And this is without taking into account carbon cycle feedbacks (such as melting permafrost and the declining efficiency of forests carbon sinks), and increase methane emissions from wetlands, which together could add another 1°C to warming be 2100.
This work compliments other recent work which also suggests a higher climate sensitivity:
- Fasullo and Trenberth found that the climate models that most accurately capture observed relative humidity in the tropics and subtropics and associated clouds were among those with a higher sensitivity of around 4°C.
- Zhai et al. found that seven models that are consistent with the observed seasonal variation of low-altitude marine clouds yield an ensemble-mean sensitivity of 3.9°C.
- Friedrich et al. show that climate models may be underestimating climate sensitivity because it is not uniform across different circumstances, but in fact higher in warmer, inter-glacial periods (such as the present) and lower in colder, glacial periods. Based on a study of glacial cycles and temperatures over the last 800,000 years, the authors conclude that in warmer periods climate sensitivity averages around 4.88°C. Professor Michael Mann, of Penn State University, says the paper appears “sound and the conclusions quite defensible”.
- Lauer et al. found that climate models that most accurately simulate recent cloud cover changes in the east Pacific point to an amplifying effect on global warming and thus a more sensitive climate.
And the bottom line? If this work is correct, then the pledges made under the Paris Accord would not produce warming of around 3°C as is widely discussed, but a figure closer to and even above 4°C. And the total carbon budget would a quarter smaller than is generally accepted, or even less.
3. Climate models under-estimate future risks
This year, the Breakthrough Centre for Climate Restoration in Melbourne, published What Lies Beneath, on the scientific understatement of climate risks. The report found that human-induced climate change is an existential risk to human civilisation, yet much climate research understates climate risks and provides conservative projections. Reports from the Intergovernmental Panel on Climate Change that are crucial to climate policymaking and informing public narrative are characterised by scientific reticence, paying limited attention to lower-probability, high-risk events that are becoming increasingly likely. (Disclosure: I was a co-author of this report.)
But don’t take my word. At the climate policy conference in Bonn, Phil Duffy, the Director of the Woods Hole Institute, explained the scientific reticence regarding the biggest system feedback issues:
The best example of reticence is permafrost… It’s absolutely essential that this feedback loop not get going seriously, if it does there is simply no way to control it… The scientific failure comes in because none of this is in climate models and none of this is considered in the climate policy discussion… climate models simply omit emissions from the warming permafrost, but we know that is the wrong answer because that tacitly assumes that these emissions are zero and we know that’s not right…
And the problems of underestimation of future climate impacts from current models was explicitly recognised by the US government in its Climate Science Special Report: Fourth National Climate Assessment. In a chapter on “Potential Surprises: Compound Extremes and Tipping Element”, two key findings were:
- Positive feedbacks (self-reinforcing cycles) within the climate system have the potential to accelerate human-induced climate change and even shift the Earth’s climate system, in part or in whole, into new states that are very different from those experienced in the recent past (for example, ones with greatly diminished ice sheets or different large-scale patterns of atmosphere or ocean circulation). Some feedbacks and potential state shifts can be modeled and quantified; others can be modeled or identified but not quantified; and some are probably still unknown. (Very high confidence in the potential for state shifts and in the incompleteness of knowledge about feedbacks and potential state shifts).
- While climate models incorporate important climate processes that can be well quantified, they do not include all of the processes that can contribute to feedbacks, compound extreme events, and abrupt and/or irreversible changes. For this reason, future changes outside the range projected by climate models cannot be ruled out (very high confidence). Moreover, the systematic tendency of climate models to underestimate temperature change during warm paleoclimates suggests that climate models are more likely to underestimate than to overestimate the amount of long-term future change (medium confidence).
The problem is that the notion that future climate changes may be faster and hotter than those projected by climate models is one rarely understood by climate policy-makers, and rarely discussed by those who do understand.
If climate policymaking is to be soundly based, a re-framing of scientific research within an existential risk-management framework is now urgently required. This must be taken up not just in the work of the IPCC, but also in the UN Framework Convention on Climate Change negotiations if we are to address the real climate challenge.