Wind and solar have set new production records in Australia’s main grid, for average generation over a quarter, record output in a single interval, and a record renewable energy share of 57 per cent in one interval in April.
The new benchmarks were reported by the Australian Energy Market Operator in its latest Quarterly Energy Dynamics report, which chronicles key milestones achieved in the National Electricity Market, and also in the separate WA grid.
The average output of variable energy sources wind and solar reached a record 7,368MW in the second quarter, a rise of 457MW over the same quarter a year earlier thanks to the addition of new projects. (See graph below). 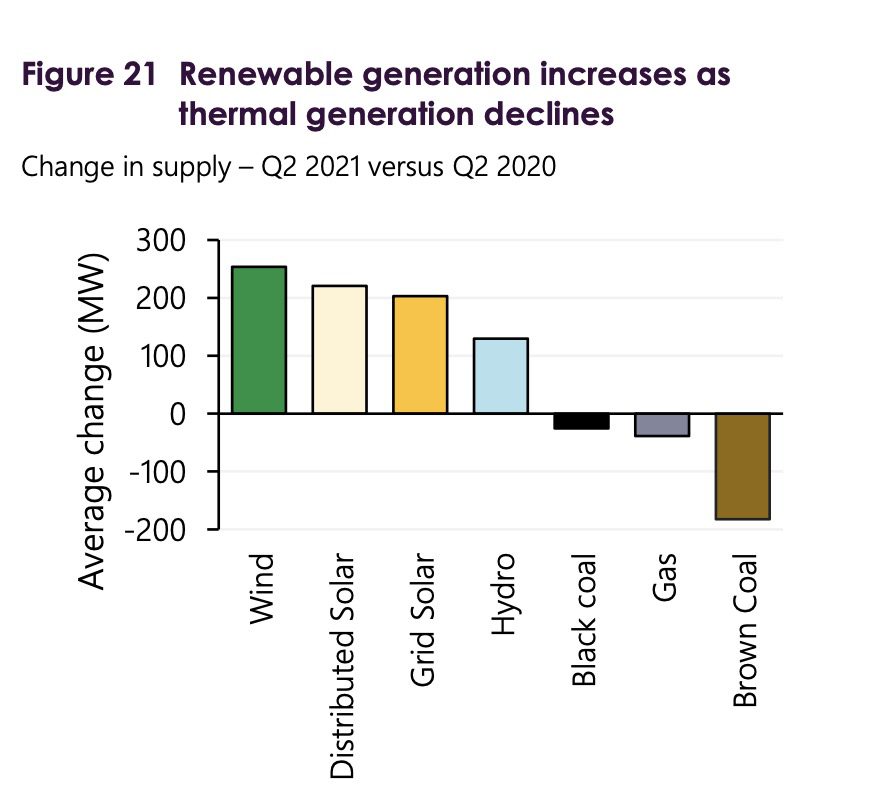
Brown coal output fell significantly due to the flooding of the Yallourn mine and its impact on the Yallourn coal generator, which produced its lowest quarterly amount since the start of the NEM more than two decades ago.
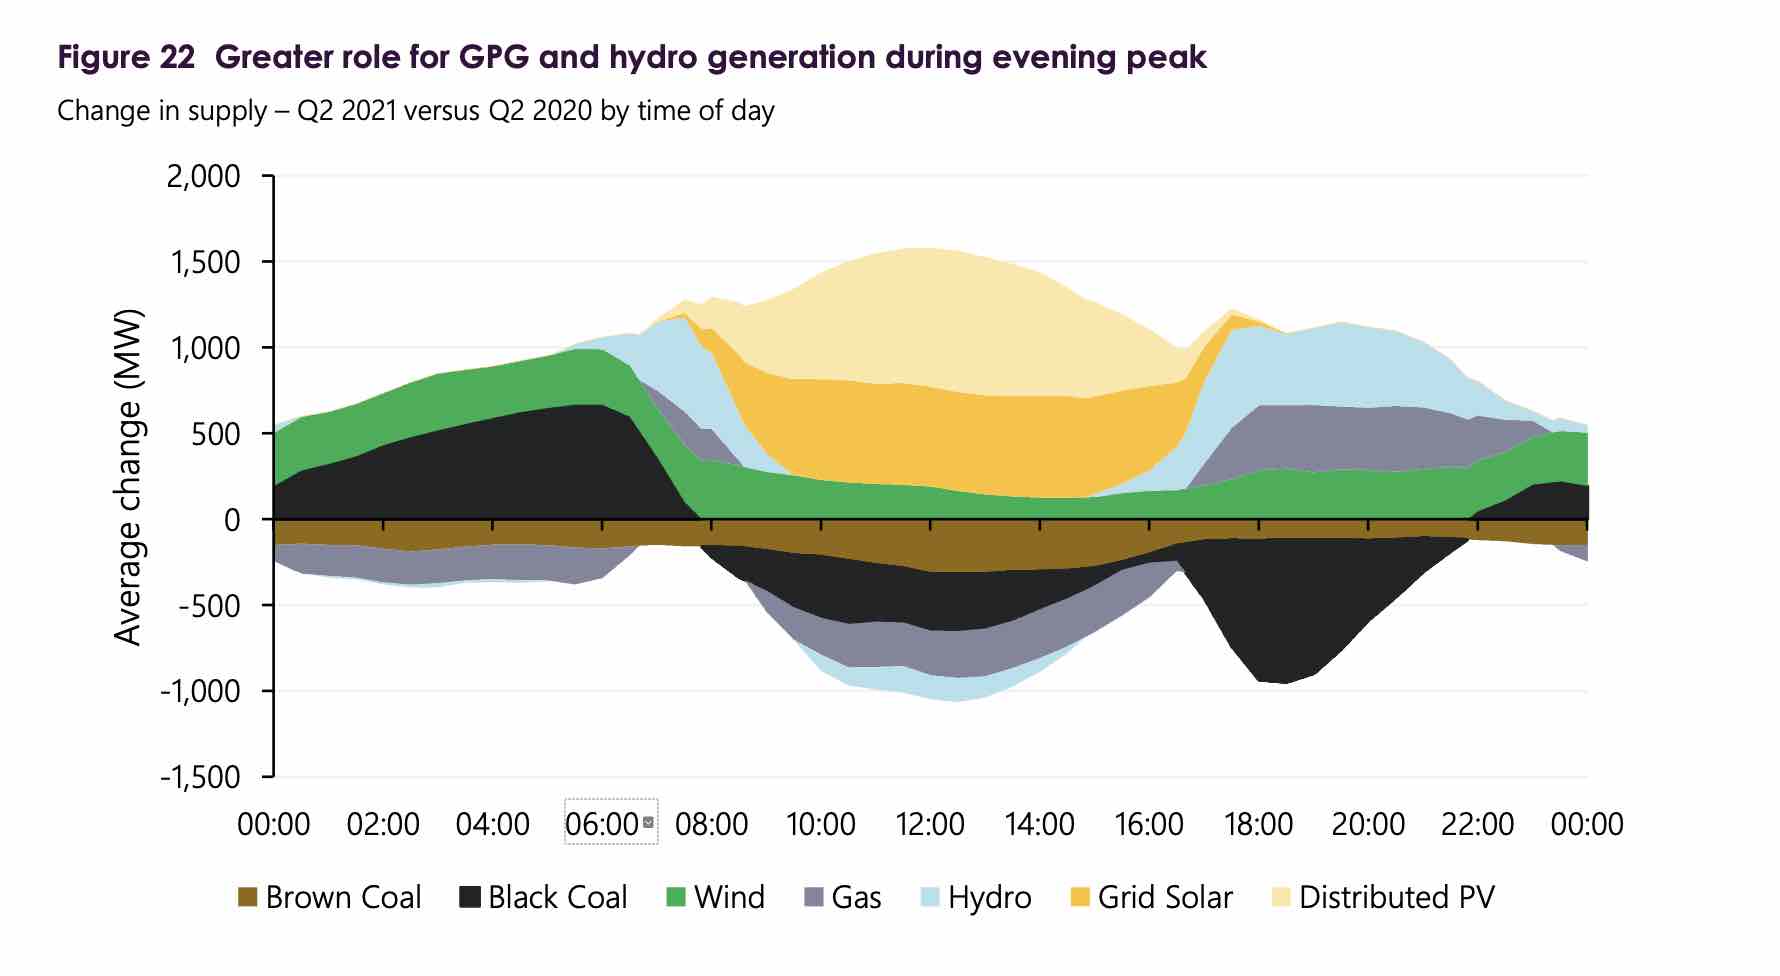
Black coal and gas generation also fell over the quarter, but the fascinating part is the following graph, showing how the grid is being reshaped by the increase in wind and solar.
The combination of rooftop and large scale solar farms pushed gas into the evening peak, and displaced all other technologies (apart from wind) during the day.
The record share of renewables of operational demand in the NEM occurred on April 11, with wind and solar, plus some biomass, hydro and rooftop PV, reaching a record high 57 per cent of underlying demand in trading interval ending 1130, up from the previous record of 56% set on October 3, 2020.
Just 90 minutes earlier, wind and solar alone set a new benchmark for the highest VRE (variable renewable energy) output of 7,370 MW, beating a previous record set in the first quarter by 484MW.
Ironically, April was a pretty lousy month for wind energy in the main grid, with low wind speeds sending South Australia to a record low quarterly average, and a wind farm capacity factor of just 21 per cent.
Victoria was also hampered by low wind conditions, but its output was increased by added capacity from the Berrybank and Bulgana wind farms, and the Bango wind farm began production in NSW.
Large scale solar output increased in both NSW and Victoria, as the Darlington Point, Limondale and Sunraysia solar farms ramped up capacity in NSW and the Kiamal and Glenrowan facilities did the same in Victoria. Queensland solar output fell slightly due to self-curtailment from negative prices.
Other interesting data of note included the amount of curtailment, which amounted to around 4% of total semi-scheduled VRE output, slightly higher than the first quarter, but along similar lines to the same quarter last year.
There are several forms of curtailment. Economic curtailment was little changed overall, because of reductions in South Australia and Victoria, but higher in Queensland (6 per cent) because of negative prices in the middle of the day and high FCAS costs, mostly as a result of all the coal plant outages.
“Other” curtailment contributed to 38MW of average curtailment this quarter, up slightly on Q1 2021, and mostly due to issues such as grid congestion and other network constraints.
System strength curtailment was also relatively high in South Australia, where wind output was capped at around 1200MW, but this cap will be relaxed to 1900MW or 2000MW once new synchronous condensers come into operation in a few weeks time.
The reshaping of the grid driven by increased renewables translated into a fall in NEM emissions to their lowest ever Q2 total at 32.1 million tonnes of carbon dioxide equivalent (MtCO2-e), 1% lower than the same quarter last year, despite an increase in demand to its highest levels since 212, driven largely by cool temperatures in NSW and Queensland.

The combination of the autumn coal, and multiple coal outages, caused average wholesale electricity prices to more than double to $95/MWh from $37/MWh in the first quarter.
The biggest increase came in the two states most heavily dependent on coal – Queensland recorded its highest Q2 average on record at $128/MWh, as did NSW ($111/MWh), with average prices in these two states at a 71 per cent premium to Victoria and South Australia.