
Last month, we reported on the fallback in the Queensland solar market, and the impact it has had upon the national solar market. It seems Queensland isn’t dead yet – indeed it remains the largest market (just) in what is now a 600MW annual base market for solar PV in Australia.
Even after the final feed-in tariff system had been installed in June, July’s installation volumes in Queensland were almost twice that of its nearest solar rivals (NSW, VIC, and SA). However, the fallback appears to be continuing, Queensland is 27% of September’s early registrations; compared with SA’s 25%, and NSW’s 19%.
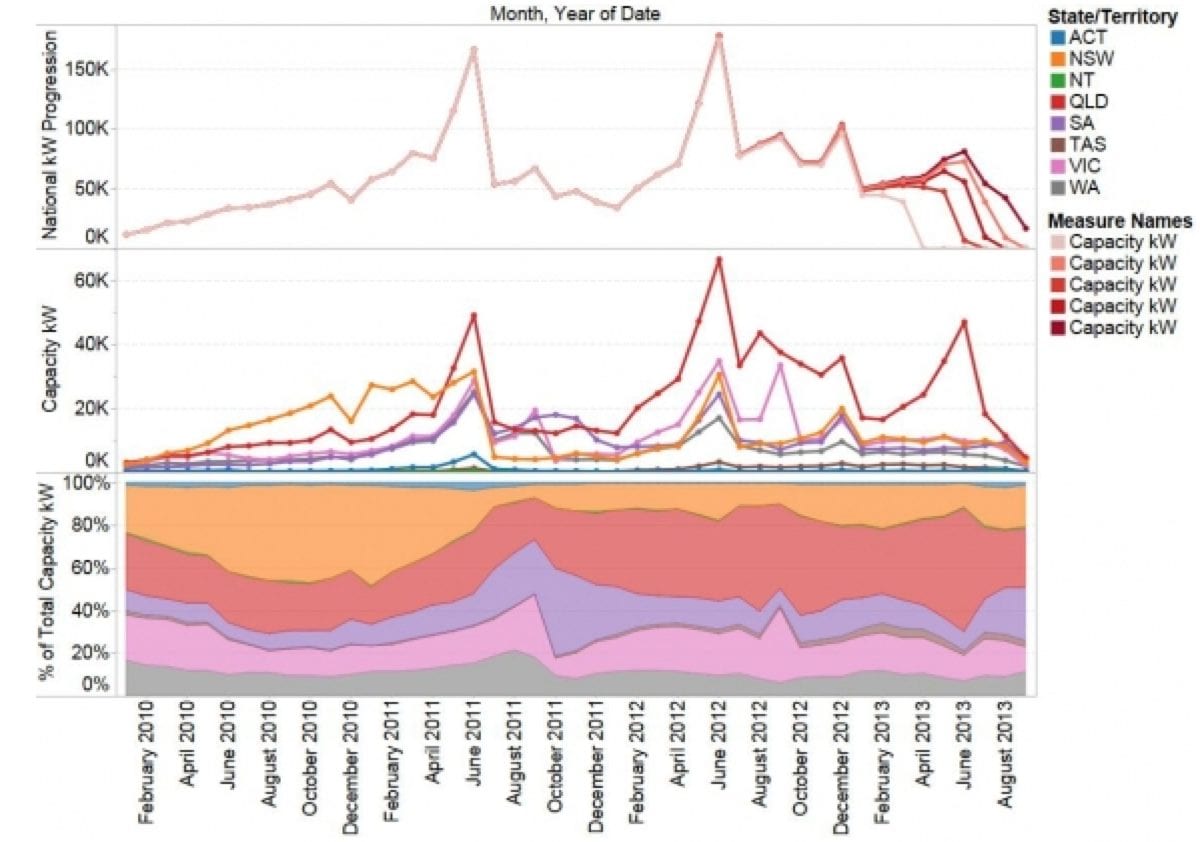
The graph above shows the monthly installation tally according to CER data releases in recent successive months, with the most recent releases shown in darker colour. When interpreting the graph, its important to correctly interpret the apparent turn down in the most recent two months since any data release, as systems can take 12 months from installation to appear in the dataset. For example, June’s installation figures appeared to be 7MW when June’s data was released, which jumped to 57MW when July’s data was tallied, and then to 73MW when August’s data was tallied and 81MW when September’s data was tallied.. The second sub-graph shows the latest information broken out by state – noting that recent months are under-represented. The third sub-graph shows the proportion of capacity that fell into each state.
Some noteworthy information falls out of this data:
- Queensland’s installation capacity in July (>18MW) was at least as high as its previous lows that occurred in early 2013 and H2 2011.
- South Australia’s installation volume is increasing in recent months, but not to the same extent as it did when it last wound back its Feed-in Tariff
- All the other states are pretty much installing constant volumes of PV.
- Outside of QLD, at least 40MW was installed in May 2013. Assuming QLD returns to equivalent volumes as NSW, this would add 11MW and mean a stable underlying market may be approximately 51MW/month – or 600MW of annual capacity. Added to this are systems that exceed 100kW (which aren’t included in these figures)
- Queensland still has 8 of the top 10 postcodes for registered installations in the past quarter. However, installations have shifted down the coast from Far-North-Queensland to South-East-Queensland.
- 5 of the top 10 locations for the last quarter are in the top 10 postcodes for national installed capacity (see image below). This indicates that solar momentum has built a ‘tipping point’ in some areas – solar is being installed because one in four households nearby have got it proudly displayed on their roof; despite reductions in government incentives.
Top 10 postcodes for registered capacity (thus far) for installations in Q3, 2013.

SunWiz’s Solar Hot Spots provides interactive visualisation of solar installation data that assists solar retailers to identify targeted marketing opportunities, and costs less than $1000 per year.