After the State of Origin loss I was beginning to wonder what the point of Queensland really is. It’s the point of eastern Australia, of course, but only geographically and only at one end.
Of course, it’s also got a use to demonstrate that the National Party heartland is in the most vulnerable state in Australia to climate change, with some $3 billion of flood damage in 2019 and crippling drought in southern Queensland.
One of the “predictions” of the renewable energy industry – kind of like a climate change testable hypothesis, but let’s not go there – is that as the wind industry diversifies geographically, its aggregate variability will also decline. I.e. If it’s not windy here, it will be windy there.
This is the “portfolio” effect. The benefit depends on the co-variance of one wind farm with others. The most valuable assets, in terms of reducing the portfolio variance, are those that are negatively correlated with the aggregate.
More specifically, the industry believed that wind generation in Queensland is likely to be less correlated with other regions’ wind resources.
Up until now we haven’t been able to test the latter part of that because there hasn’t been any wind generation in Queensland.
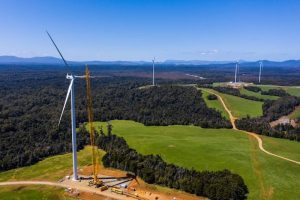
However, we now have about nine months of output from Mt Emerald wind farm (soon to be supplemented with Cooper’s Gap). Even the Kennedy wind farm may one day be connected to the grid.
This gave ITK an opportunity to use NEM Review, that great product from Global Roam, to re-run some correlations. We first wrote these up a couple of years ago but, as Bob Dylan was wont to sing, “Things have changed”.
The answers are not robust because nine months of data is far from sufficient. But what there is, is encouraging.
 Figure 1 Wind generation, regional correlation. Source: NEM Review
Queensland is negatively correlated with every other state, and with the NEM for wind output.
When its windy in Queensland, it’s likely calmer in Tasmania. One might argue that wind in Queensland thus reflects the Queensland character, but as I said earlier, we are not going there.
To conclude, Queensland has much to gain from developing its wind resource and wind in Queensland per megawatt hour (MWh) has a higher value than wind in South Australia, assuming both states had equal generation prices.
In any event, development of wind in Queensland will benefit the electricity system generally. North Queensland has clear electricity transmission issues, but the Copperstring project demonstrates that further development is likely and this will bring benefits to many.
Wait there’s more
There is some more news in the table. The bottom section looks at the absolute variability of the wind in a region. This is measured expressing the standard deviation as a percentage of the average. The standard deviation is a measure of variability. Broadly 2/3 of all observations fall within +- 1 standard deviation of the mean.
The bottom half of our table shows big standard deviations for South Australia and Victoria, the main wind producing generation regions in Australia at present. They have that variability, even though they have lots of individual wind farms.
By contrast, the good news is that NSW has a relatively low standard deviation, not much above that of wind in the NEM as a whole. Again we caution against making too much of the data.
Lower variability in the wind portfolio means more predictability in its output and less need for dispatchable generation.
Equally Higher capacity factors imply lower variability. If the capacity factor is 100 per cent, the standard deviation is zero. Higher capacity factors in variable renewable energy [VRE] definitionally mean less need for dispatchable power.
For that reason, the higher capacity factors in wind and in solar actually have more benefits to the aggregate system than are generally realised.
Finally, looking to the near future, offshore wind turbines can be expected to have higher capacity factors than onshore ones, generally speaking. For instance, Europe’s on-land wind farms have an average capacity factor of 22 per cent, compared to 37 per cent for offshore wind farms in Europe.
There are no offshore wind farms in Australia, of course, but I wouldn’t be too surprised if a 60 per cent capacity factor was advertised for one.


