It’s an exciting time for energy policy in Western Australia, after the Liberals’ decision to ‘one-up’ Labor by making an election promise to close all coal fired power stations within a few years and by 2030.
Last week there were two significant events: An AIE (Australian Institute of Energy) sponsored debate between the parties’ energy spokesmen and a presentation by the Whole of System Plan team outlining the new Western Electricity Market, which is a laudable achievement.
WoSP chair Stephen Edwell said that there would be no need for thermal ‘base load’ as long as RE (Renewable Energy) ‘stepped up to do the job’ and that if Government decided to close down base load ‘the market’ would need to bring in RE and storage quickly to maintain network stability.
In other words, Government will decide how quickly to progress the transition to clean energy by choosing when to close coal and gas thermal. It is unfortunately on a ‘go slow’ setting now, as WoSP has coal generating for another 20 years and does not even plan the wind and storage needed for 85% renewable energy.
What stood out for me in both of these events is that no-one from either party could point to transparent modelling of a cost-optimal system energy mix.
The Liberals’ David Honey spruiked their plan for a 6000MW renewable energy generation project between Geraldton and Shark Bay producing hydrogen for export.
They say this 100 km stretch of coast is optimal because ‘it has the highest wind capacity factors’. Minister Bill Johnston disagrees, saying that southern areas are best for future wind, but the WoSP does not include any increase in wind generation for at least a decade!
Neither side has given clear answers to other crucial questions.
Labor has had four years during which they paid Ernst and Young millions to model system scenarios but have shown the public little.
My previous article outlined a cost optimal 85% RE clean energy mix compared to the four wildly differing and apparently un-costed 62% RE options given in the WoSP.
Following on from that, I will throw some light on two more crucial questions not yet answered:
1/ What is the cost-optimal energy mix?
2/ Which areas are best for locating future renewable energy?
I will address a third question – what should be the role of gas during the SWIS transition to RE – in another article
What is the optimal energy mix; in particular what role will solar PV and storage play?
A cost optimal energy mix for the SWIS is explained in detail here and it is summarized in Table 1, Scenario 3 below. Wind generates 48% of the energy and PV 37% (even though PV has more installed capacity).
The RE must be in place before coal is closed and I stress again the need for a rapid build out of RE to avoid failure of ramping-challenged steam thermal.
David Honey gets a tick for pointing to problems with steam thermal ramping, which I have explained here. He said he has encountered them while running thermal power stations earlier in his career.
Labor obviously does not agree or has chosen not to address the issue as they have the SWIS stuck on 62% RE with coal still running in 20 years’ time!
Although 85-95% RE is achievable with either mostly wind or mostly PV, PV dominant scenarios like that outlined in the WoSP base case are not the way to go.
They cost more, require much more storage and rooftop PV is inefficient.
To illustrate this, I’ve modelled three 85% RE scenarios using the open-source SIREN and PowerBalance2 software (see Table 1):
- Rooftop PV supplies 77% of demand. Wind is left at the current 1020 MW of capacity and utility PV at 200 MW (similar to WoSP base case).
- Half rooftop and half utility PV supply 77% of demand (28% and 38% respectively). Wind is left at the current 1020 MW of capacity.
- The cost-optimal wind dominant scenario. Wind (4200 MW of capacity) supplies 48% of demand and a mix of rooftop and utility PV supplies 36%. Even though wind capacity is lower than PV it generates more because it has a significantly higher capacity factor.
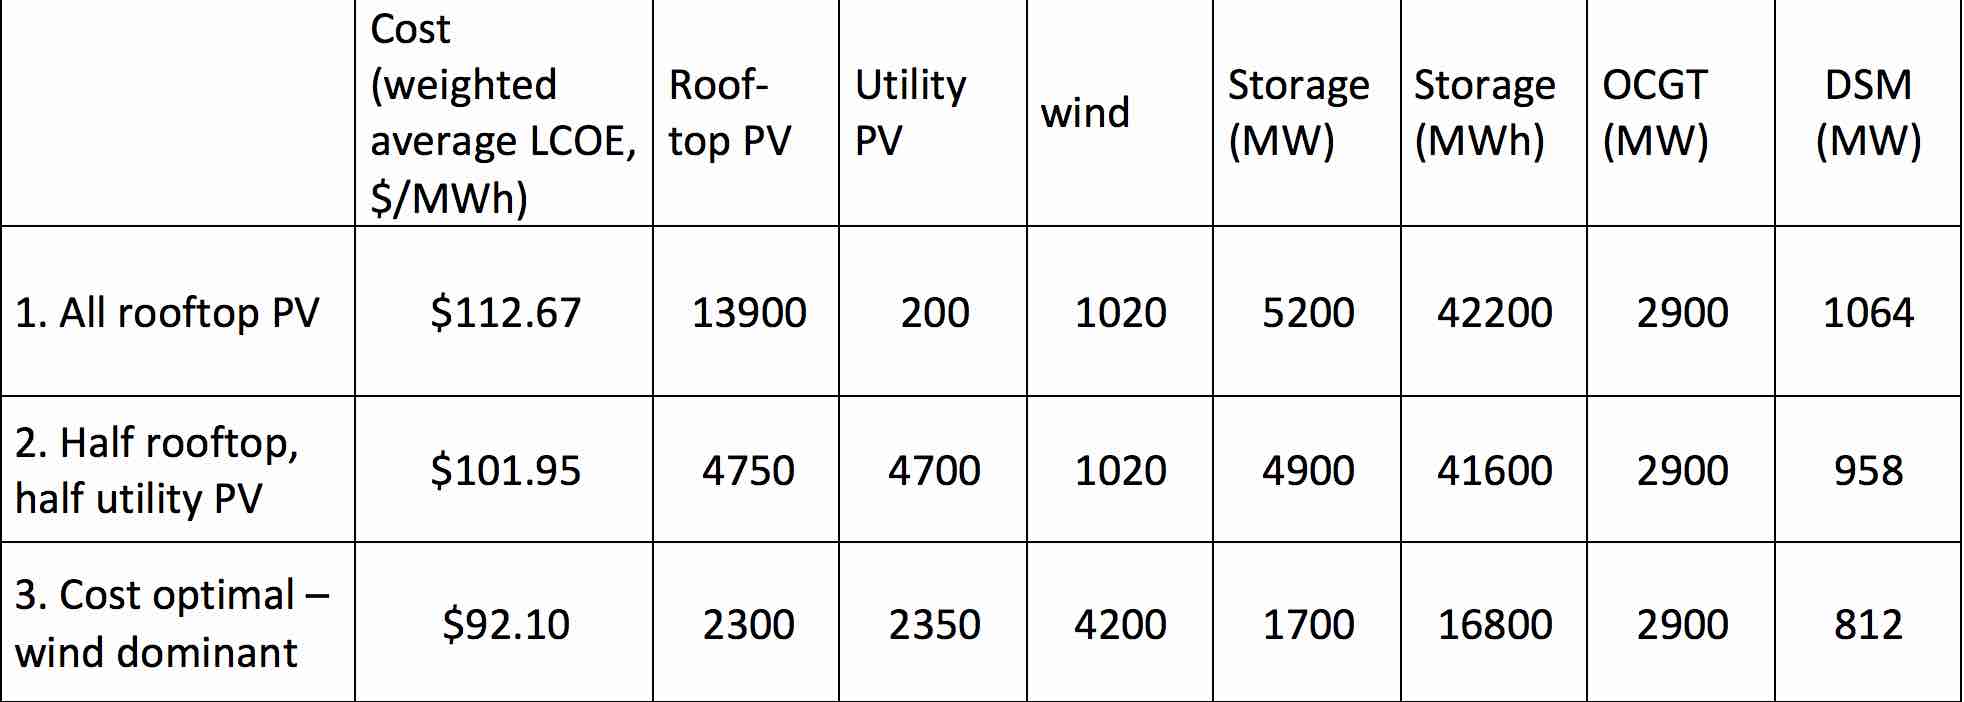
Table 1. Comparison of three 85% renewable energy scenarios for the SWIS – two PV-dominant and one wind-dominant
Assumptions:
Demand is 25 million MWh/ year (1.35 times 2014 level).
Technology costs are from AEMO, 2018.
4-hour battery capex is from WoSP, 2020.
Cost of capital is 6%/yr for all but rooftop solar, which is 3%.
Rooftop PV dominant requires 2.5 times more energy storage and 3 times more storage power than the optimized scenario and costs $21/MWh more.
The half rooftop and half utility scale PV scenario still requires similar high storage capacity but only 2/3 as much PV capacity and costs $10/MWh more than the optimal scenario.
Utility PV is more cost efficient, as it can either track the sun or is optimally oriented with half of the panels NW and half NE facing.
It provides generation over a wider time band and can also be optimally located at wide spaced locations, better utilizing areas of clear skies during winter.
The only possible benefit of solar dominant scenarios is that they would require less new HV transmission lines, which may save up to $4/ MWh.
However, the additional cost of the high PV power capacity and the huge amount of storage required is $10-21/ MWh.
It would be a huge task to plan and install the 40,000 MWh of storage required. It is cost prohibitive to supply that much energy storage from batteries (either grid scale or behind the meter).
Using PHS, water volume required would be 7 to 10 of our larger water supply dams and total power capacity would need to be double that of existing OCGT’s.
On the other hand, the 16,400MW of PHS and 400MW of batteries required in the optimal wind dominant scenario is achievable.
Another option is to use 9,000MWh of PHS, 500MW of 4 hour storage batteries and 400 MW more of wind and utility PV, which would cost about $1/ MWh more.
Either option could be in place by 2030, if planning starts soon.
2/ Which areas are best for locating future renewable energy?
High capacity factors are not the only consideration in the location of wind, as much of the generation during windy periods is surplus to grid demand and will probably be spilled.
Wind is most needed in the winter when solar PV generation is low.
I modelled wind generation for 99 areas in a grid covering the SWIS area, using SIREN software with 11 years of NASA MERRA data.
The results show 14 areas in the Great Southern and South Coast with more than 10% higher than average winter wind generation. There are another five along the South West and Mid-West coasts.
But most importantly, generation is often higher in the south while it is lower in the north and vice versa. In other words, southern wind generation will complement that already installed in the Mid-West north of Perth.
Note that with the latest 4- 6 MW wind turbines at optimal wind resource locations, generation will be even higher than what I have modelled here using 3 MW turbines and average wind resources over two 100 km square areas in the MERRA data grid.
The modelling results show conclusively that most new wind should be located in the Great Southern from east of Collie down to the South Coast. This will require new 330 kV transmission south from Collie.
The graph in Figure 1 illustrates how generation in the south is beneficially ‘out of sync’ with that in the Mid-West during winter.
Figure 1. 100 MW of wind generation at two good winter wind locations – 380 km N and 310 km SSE of Perth during 6 weeks in July -August 2015
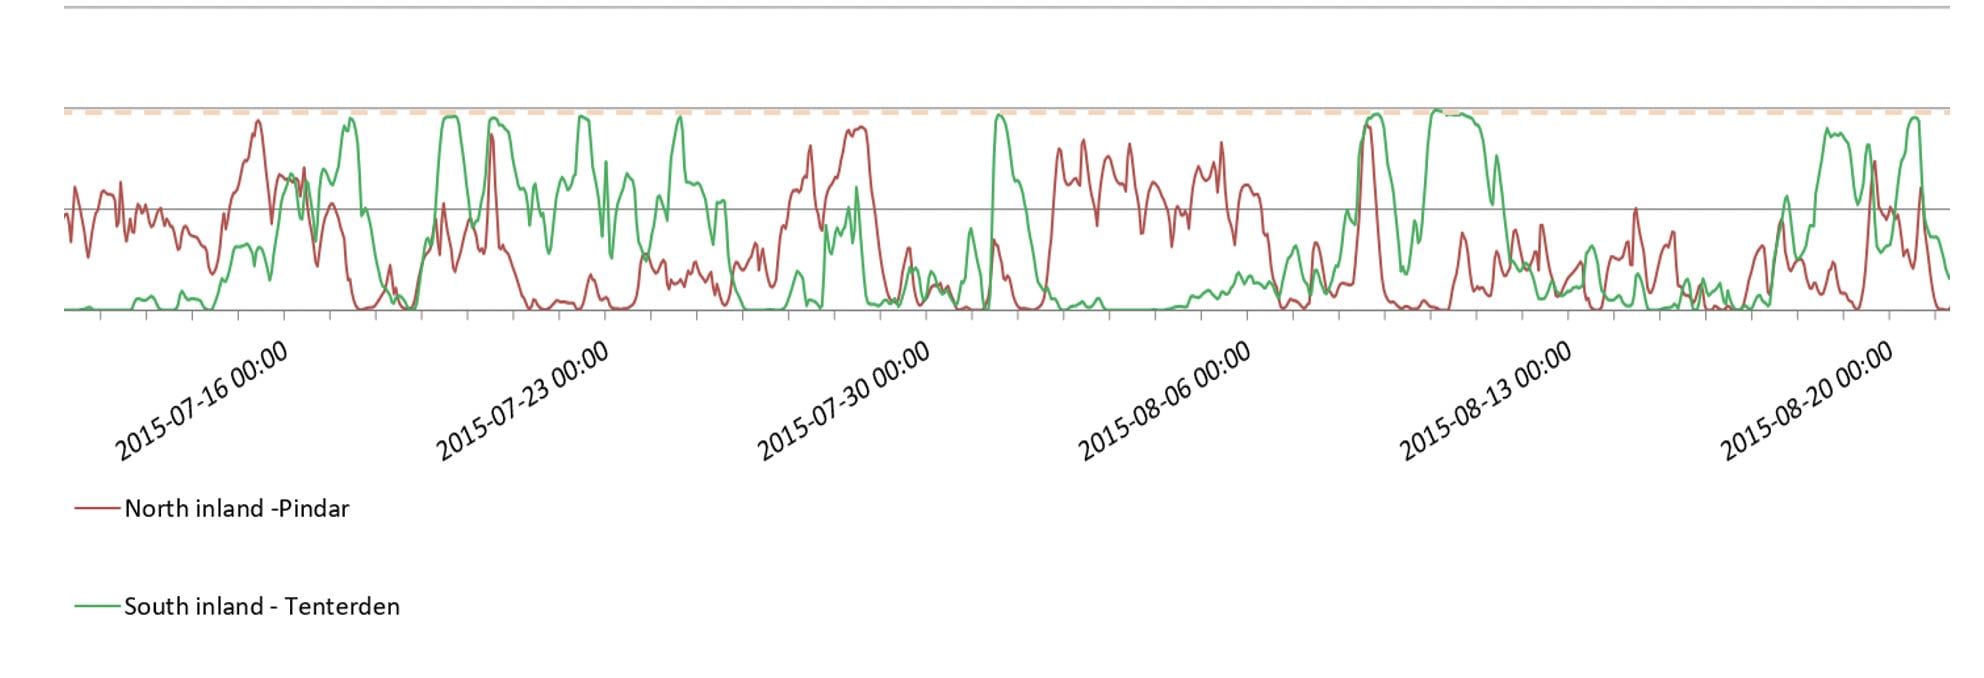
Figure 2. Location of renewable energy power stations in the cost-optimal 85% scenario
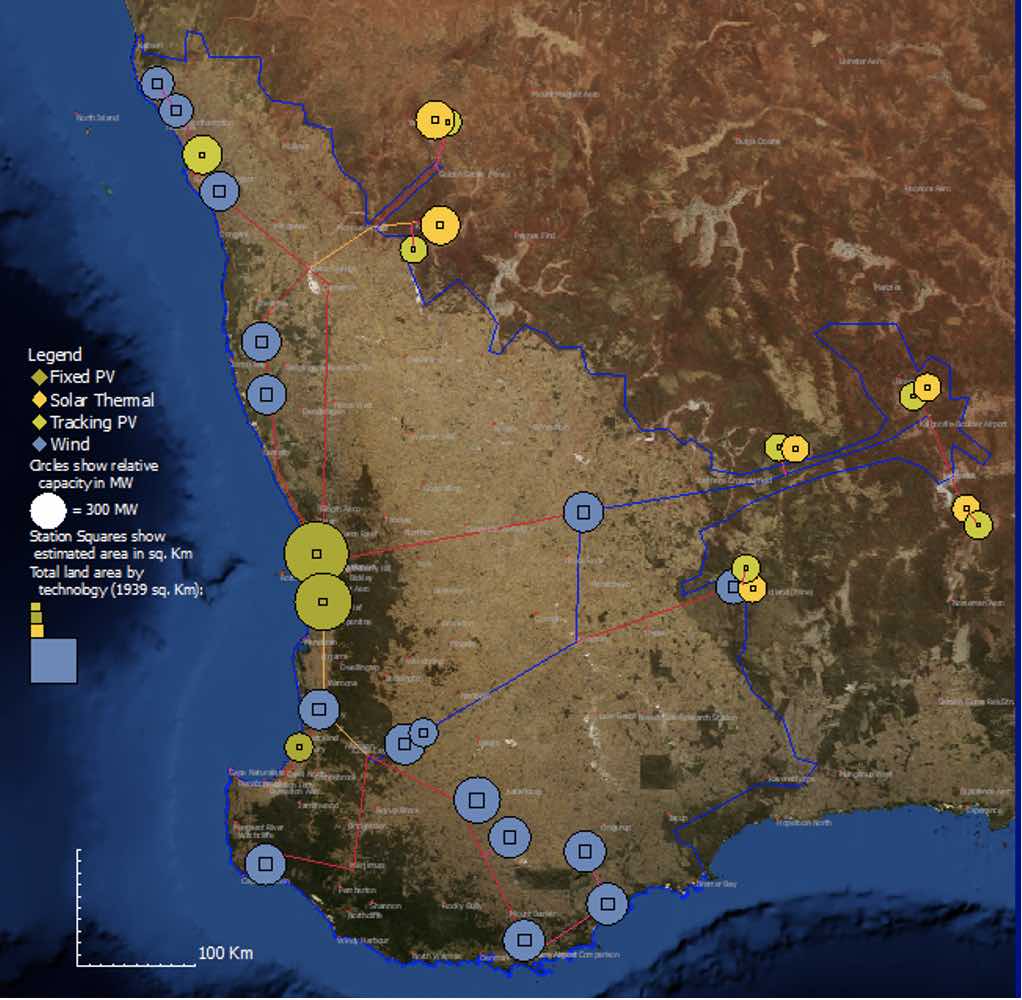
Solar power stations are best located in northern and eastern areas of the SWIS (see Figure 2), where winter cloud cover is less.
The effectiveness of these dispersed locations is illustrated by the results of the 85% RE optimized modelling outlined in Table 1, in which power stations were located as in Figure 2 above.
Half metro rooftop and half dispersed utility PV gave the same output as all metro rooftop PV, for only 2/3 as much capacity.
Some co-location of a lesser amount of PV with wind is also desirable to make best use of transmission lines.
I have illustrated these points in a presentation to the WoSP team and to their credit they heard me out. But somehow it all got lost in a black hole somewhere between there and EY’s output.
My offer to further discuss this modelling with Minister Bill Johnston, the WoSP Team and EY is always open.
At least three thousand MW more wind generation capacity – fifteen more windfarms like the very successful Collgar, Badgingarra, Yandin and Warradarge – are needed to supply clean cheap electricity for WA.
Wind is a mature technology with capex only forecast to fall a few percent. But interest rates can only go up meaning that wind is unlikely to be cheaper in future.
Time to get cracking on more wind installations and earlier retirement of steam thermal.
There are many farmers in rural areas keen to supplement their income and many rural towns wanting more jobs.