Talking Sankey, Sankey
Its hard to do justice, in a reduced copied image, of the work that the Dept Industry, Science, Energy and Resources put into producing a Sankey diagram of Australian energy flows.

The original document can be found at Australian Energy Flows 2019-20 along with associated source data. Even without study of the detail and given that the diagram, despite the work, could still use a couple of extra labels one can still see:
(1) The cyan colour (electricity) is fairly small;
(2) Most of the coal and gas is exported, duh! and;
(3) Production losses and “own use” of 1747 PJ are double the 858 PJ of electricity production that goes to final energy consumption.
Let’s be honest, we are so so far from electrifying Australia and becoming a “renewable energy super power” it’s almost, but not quite, laughable.
Breaking down and re-aggregating the energy flow diagram we can see that oil represents about 50% of final consumption by fuel and that about 30% of the coal and gas production for domestic use is self-consumed, either in the process of being extracted or the low thermal efficiency of coal and gas fuelled electricity generation.

It is interesting that when you think about energy, rather than emissions, oil – most of which is imported – is 50% of the total. Oil is, politically, actually the easiest sector to eliminate in Australia; the one where there are next to no vested interests to deal with. And by reducing oil consumption, easily done, we can improve our balance of trade, improve our energy security and decarbonise.
I mean, come on Canberra. You are there for a good time not a long time. Make it happen.
I don’t show it here but a time series look at final demand will show that, compared to 10 years ago, electricity’s share is flat to down, gas share is up. So not good enough. Then we can move on to look at the composition of final demand by user. Again, let’s go with the main aggregates.

The messages here are clear. Transport is the dominant consumer of energy. It is ironic it’s the product we import. Even more ironic is that it’s the sector we could most easily electrify – and yet progress is glacial.
Secondly is to point at mining. Mining is so far not doing the electrification it needs to, even though the mining industry is full of people interested in the topic.
Equally, since the vast majority of mining output is exported, it’s clear that the consumption of coal and gas within the mining sector as well as its final transport is a major contributor to Australia’s emissions.
And so, essentially, there are lots of emissions associated with mining and exports. This is not a knock on mining, where Australia is a world leader, but an observation on the opportunity.
Safeguards scheme – Do new coal and gas projects make it completely pointless, or merely blunt the impact?
As we previously opined just after the election, the centrepiece of the ALP emissions policy, as opposed to the legislatable but fairly useless target, is to tighten the safeguards scheme to require a fall of about 5 megatonnes per year from a starting point of 143 megatonnes. So, in 10 years, after the scheme starts, those emissions are supposed to fall by 50 mt, reducing overall total Australian emissions from all sources relative to today by about 10%.
To be frank, ITK has doubts about the policy. It’s tackling the hardest to abate sectors first, instead of the easiest to abate sectors. Still, as we will say several times, we must – like Oliver Twist – be grateful for what we are offered because the alternative is worse.
And tightening the safeguards scheme is sound policy, it’s just the difficult part rather than the easy pickings available in electricity and transport.
Never mind that 5 megatonnes is less than 1% of emissions; that’s what’s on offer and because any policy is better than what the Liberal National Party were offering, we should, and to an extent are, grateful.
But not so grateful that we can overlook pointing out what a farce it is to allow new coal and gas projects at the same time as the existing ones are required to reduce emissions.
Note, this is not a statement about whether new coal or gas projects should go ahead. It’s a statement that requiring existing projects to reduce emissions but at the same time allowing new projects is fairly pointless and also seemingly unfair to existing projects. That is unless the new projects pay and pay heavily for the privilege.
Contrary to what I last wrote, coal and gas are not responsible for 25% of Australia’s scope 1 emissions, even though exports of goods and services, which include agriculture, are about 40% of scope 1 emissions. A little checking shows that coal and gas production, excluding say coal transport to port, are about 67 megatonnes or 14% of emissions. And as we show later, we could add another 50 mt, maybe, for the ocean transport of these products.

It’s still a big number and other sources point to even higher emissions from gas production. It takes on even more significance when we look at the safeguards scheme.
The following graph shows a summary, by industry, of the 53 largest covered emitters, remembering that electricity emitters are excluded. Emissions from those 53 facilities total 100 Mt out the 143 covered by the scheme and which are subject to the potential 5 Mt per year reduction. I allocated each facility to an industry and I included Bass Strait in gas.
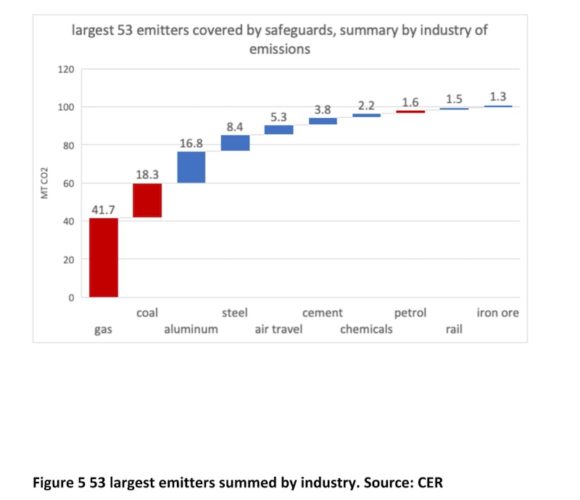
I note that the 41.7 Mt of gas is almost double what the CER analysis shows and this may be due to some double counting. The graph only covers coal mines that made the top 53 largest emitters from all sources. So most medium and small coal mines are not shown.
Digging into the weeds, here is a sorted list of the top 29 emitting facilities. It’s a list dominated by gas.

Another difficulty is that the government has stated that all the “export” industries covered under the safeguard scheme will have “tailored” treatment. Well guess what. They are pretty well all export oriented. So if they are all tailored then it seems like we’ll have to kiss bye bye to the 5 Mt. And yet there is always a different way to cut the numbers, particularly given a bunch of bright bureaucrats.
Shipping coal, gas and oil nearly doubles the emissions from production
Globally, shipping of all kinds results in about 1 billion tonnes of carbon emissions a year (i.e. two Australias) and represents about 2.5% of global emissions. See Transport and Environment.
It turns out that shipping coal gas and oil is around 40% of the total. Yes you read that right, shipping of coal, gas and oil is over 40% by weight of all global shipping trade. The numbers come from United Nations Conference on Trade and Development. To get the emissions from oil tankers it’s just their share of global shipping as a share of 1 billion tonnes of global shipping emissions, and so on.

The Australian derived contribution to global carbon emissions from the shipping of fossil fuels produced in Australia is a bit of a stretch. The method was to work out Australia’s share of global trade in each commodity using the BP data and then to apply that share to the global emissions from the global sea transport of that product.
The data used to derive the shares is in exajoules.

Based on the above data it appears that, in addition to the over 60 Mt of emissions from the domestic production of coal, gas and oil there is another 50 Mt of emissions involved in shipping the product – and no doubt still more emissions in transporting it to the port of export and from the port of import to where ever it’s finally consumed.
Yes, Minister
Your analyst has always appreciated humour and, even if satire is the lowest form of wit and irony be far superior, nevertheless “Yes, Minister” was generally a good jolly.
As an avid student of irony it causes no more than a smile to note that we have policies like in Victoria where the aluminum smelter (the consumer) is subsidised and both a fossil fuel part supplier (Yallourn) and the renewable energy suppliers are also subsidised.
I have gone off reservation bringing in Portland and Victoria only because, to demonstrate that the federal government, and no doubt most voters, are unlikely to see any problem in forcing existing gas producers and coal producers to reduce emissions by 5 Mt per year out of 143 Mt total, or say 3%, and yet at the same time allowing new coal mines and gas facilities to start up.
And new gas projects are largely in West Australia. And as far as the ALP goes, whatever West Australia wants in the way of new gas projects, it can have.
Give us an A, Give us an L but don’t take the P
And hurrah, hurrah, however timid and contradictory ALP policy is, it’s better than the Coalition and we will always be grateful. And if I were in Albanese’s place I doubt if I would have the stomach to ban new coal and gas projects.
But what I would do is make them pay heavily for the cost they are going to impose on the future of the world. I would frankly tax the guts out of them. And I’d tax the existing projects a whole lot harder.
Were I advising the ALP my policy prescription would have included:
– In regard to electricity, increase the LRET target to say 65% by 2030 and allow RECs to be used as well as ACCUs to discharge “safeguards obligations”. Increasing the target to 65% is a way of forcing the existing large gen-tailers to finance more wind and solar and taking the burden away from the states.
– Mark Butler’s residential battery program could be revived. It dovetails well with AEMO’s ISP modelling and would be politically popular as well as really useful. I’d also charge the ESB to work on a revision of the current NEM functional design that is the separation of retail, generation, distribution and transmission.
A place may need to be found for the large-scale deployment of community batteries in the way WA is doing it without having to go through endless regulatory jumps. In any event, some kind of storage scheme analogous to the LRET is likely a goer. This would provide opportunities for pumped hydro and batteries to compete.
Despite the ESB analysis, I am intuitively drawn to the Californian four-hour capacity credit model, as it targets diurnal storage. Diurnal storage is clearly the emerging market needed once we build the bulk wind and solar farms.
– Legislate vehicle tailpipe emission standards just about the same as Europe, maybe with a two-year adjustment phase. In my opinion, this is an easy win for the government. Future research will look at how much this could save a year in emissions compared to the safeguards proposal.
– Put some weight behind 7-star residential building. The built environment is a major consumer of energy and carbon emitter. There is a tonne of work done in this sector already, it’s true, and yet the perception remains that the overall results are not that flash.
– Raise taxes on coal, gas and oil production. We can do it for tobacco we can do it for fossil fuels.