Against many predictions, and the ill-will of stock-market short sellers, Tesla is breaking through and redefining the car market in the US. These three graphs explain how and why.
The graphs, released by industry statistician EV Volumes, back up the news from Tesla CEO and founder Elon Musk that the Model 3 is the 5th best selling car in terms of volume, and the biggest by value, helping to drive the company to a long-awaited profitable quarter with margins of over 20 per cent.
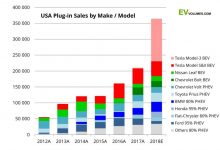
The graph at the top illustrates how the Model 3 has lifted overall sales or EVs and hybrids in the US, which have charged past the one million mark.
The 2018 total sales for plu0-in cars is expected to jump by 82 per cent in 2018, to take a total share of the new car market in the US of 2.1 per cent. Half of those sales, and three out of four full battery electric vehicles (BEV) will come from Tesla.
The next graph below shows that sales by volume of the Model 3 in the US – despite its high price of $US49,000, are catching up to popular family cars like Toyota’s Camry and Corolla, as well as Honda’s Civic and Accord models.
Read the full story on RenewEconomy’s electric vehicle-dedicated site, The Driven…
You can also sign up to TheDriven’s regular, and free, newsletter here.