Australia’s growing number of wind and solar farms are learning how to dance around the increasing number of negative pricing events in Australia’s main electricity grids, and even some coal units are showing some surprising flexibility in dealing with volatile prices.
The latest quarterly analysis by the Australian Energy Market Operator shows that in the December quarter the number of negative pricing events increased dramatically in states such as South Australia – which has the higher share of wind and solar at around 60 per cent of state demand – and Victoria, which added the most amount of new wind and solar in the latest quarter.
Negative prices might be good for batteries and other storage installations, but generators don’t like them, because it usually means they have to pay to generate. Some have signed power purchase agreements that require them to shut down when prices go below zero, while others have added new software technology that allows them to predict and dodge such events through new bidding strategies.
In its Quarterly Enegy Dynamics report, AEMO notes that new wind and solar farms are more responsive to these volatile price movements than older installations.
“With Victorian negative spot prices occurring at record levels this (December) quarter, the price responsiveness of wind and solar farms in the region increased, with some participants raising their offer price to ensure they were not dispatched during negative prices,” AEMO says.
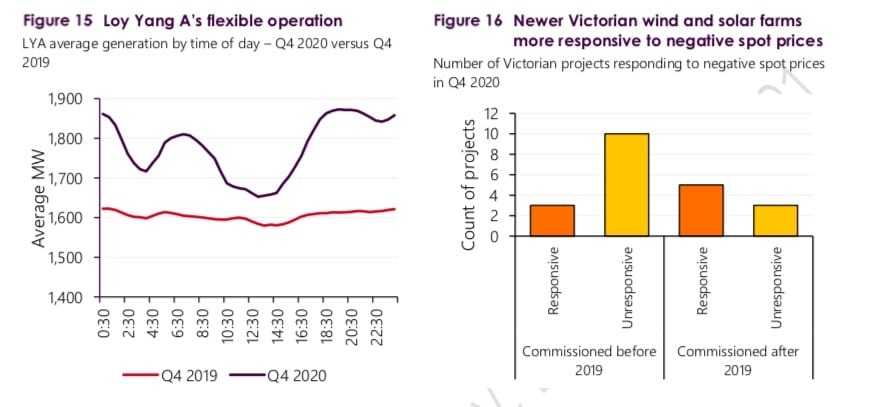
This is classified as “economic curtailment” and AEMO says it has become most prevalent in newly commissioned projects. During the quarter, eight of 21 semi-scheduled projects in the Victoria region demonstrated re-bidding in response to negative prices, with five of those projects being recently commissioned, AEMO says.
Even ageing brown coal generators got into the act – at least those that could. AEMO observes that Loy Yang A showed increased flexibility by also shifting marginal capacity to higher price bands (from around $10/MWh to $35/MWh), so they wouldn’t be dispatched. (See graph above)
This meant that Loy Yang A – which AGL reckons could operate until 2048, but most analysts say will likely need to close much earlier – ramped down overnight and in the middle of the day. Other brown coal generators such as Yallourn are less flexible, and are tipped to close before 2030 because of this.
Overall curtailment of wind and solar rose to its second highest level of 5.2 per cent, or an average of 191MW.
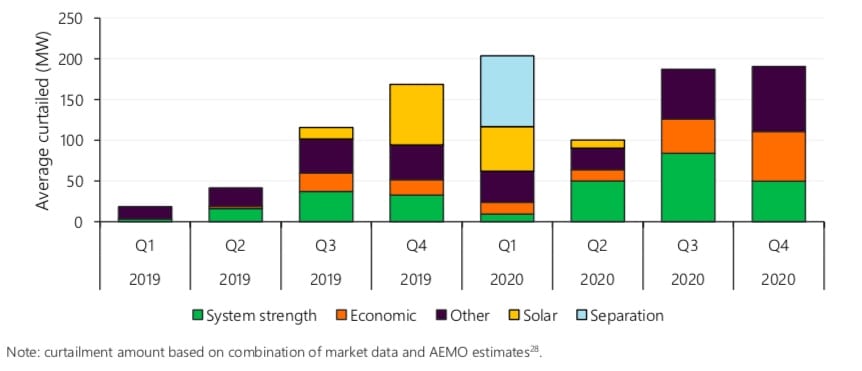 Around one third of that was from the economic curtailment described above, but the amount of curtailment from system strength issues fell, mostly due to fewer periods of low demand in north Queensland and a change to inverter settings at the Mt Emerald wind farm.
The biggest factor in curtailment was due to transmission issues such as outages, grid congestion, and other network constraints, contributed to an average 80MW of curtailment (up 37 MW on Q4 2019 levels).
Most wind and solar farm owners and developers factor in a certain amount of curtailment into their business models, and it also creates an opportunity for storage and possibly hydrogen.
And the roll out of wind and solar hit new peaks.
 During the quarter, nine new projects (six solar, three wind) amounting to 1,280 MW of installed capacity commenced generation, the highest quarterly addition since Q2 2019. This led to several grid scale records in the last quarter.
This new capacity, coupled with continued ramp up of projects from previous quarter, resulted in several grid-scale VRE records19 this quarter, including:
- Highest grid-scale VRE share of NEM operational demand (not including rooftop solar) – NEM VRE output met 36% of NEM operational demand at 0930 hrs on October 3, 2020.
- Highest grid-solar output on record – NEM grid-solar output (not including rooftop solar) reached 3,210 MW at 1230 hrs on November 30, 2020.
Grid solar generation reached a record quarterly high of 1,018MW on average, and average wind generation was 2,441MW.

