Large-scale Generation Certificate (LGCs)

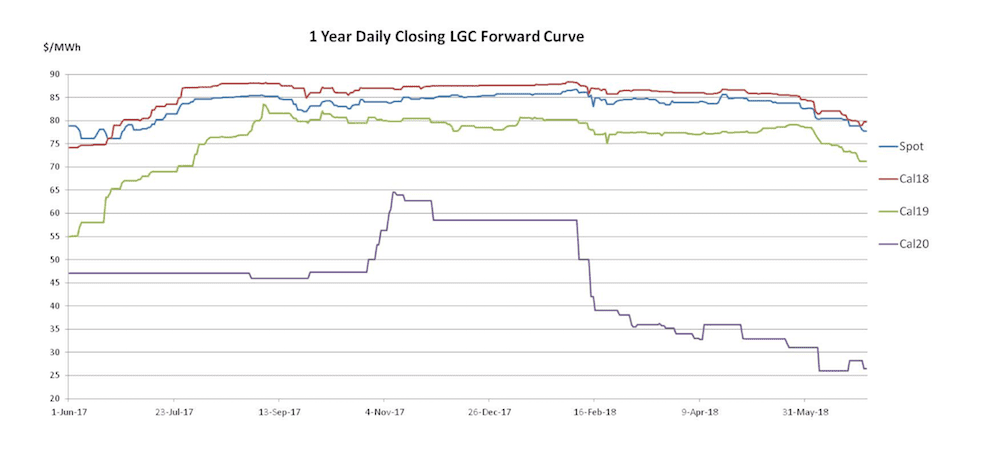
The end of the financial year saw a sharp decline for the entire LGC forward curve with the spot falling to its lowest level in 12 months.
While recent years have yielded softer pricing between the compliance period and 30thJune, there is plenty of debate this time around as to whether this is simply another example of that cyclicality or instead something different.
While the spot LGC market opened the month steady in the mid $82s, it wasn’t long before the bearish sentiment that brought May to a close returned.
Within a week the market had breached the $80.00 mark and, though some support did emerge slightly afterward offering some respite from the losses, it ultimately proved short lived. By late June the spot had reached a low of $77.80, a price not seen since late June 2017.
The Calendar 18 market followed the spot down across the month, opening in the mid $84s and finishing up at $78.75 as the most liquid of the forward vintages during this time. In the Cal 19s a thinner market opened in the low $78s and softened to a late month low of $71.25.
The Calendar 20 vintage declined from $30 early in the month to close at $26.50 on modest trade volumes and whilst the Cal 21s traded only once at $27.00. By month’s end the bid/offer spread implied a price closer to the low $20s at most.

In each of the last three years the LGC market has softened over the same period to the point that there are those explain the recent price reductions as part of the cyclical nature of the compliance market.
Indeed from the passage of the previous year’s compliance on 14thFebruary to the end of the financial year, sellers have seemed to outnumber buyers in recent years.
In part it may be that buyers want to defer further purchases until the new financial year or conversely that sellers need to sell in advance of it. Perhaps psychology or general timing of procurement simply sees buyers more active later in the year.
There may also be many other explanations for the phenomenon. Irrespective, the main question being asked this year is whether the price slump which has affected the entire forward curve is simply a repeat of this cyclicality or instead evidence of a more fundamental change to the market.
In previous years the softening in price has also come with speculation surrounding the project pipeline and its impact on the supply/demand balance.
This year we are both another year closer to the all important Cal 19 and Cal 20 periods and coming off the back of a steadily flow of previously unprecedented commentary from the Clean Energy Regulator asserting that the target has been met and that a surplus will remain throughout the coming years.
If this thesis is correct, then it is possible that the steady bleed that has characterised the market across the last few months may continue, with the spot, Cal 18 and Cal 19 markets continuing to soften to reflect the fact that the scarcity assumption that has buoyed the market for the last 3 years has been found to be incorrect.
Yet there remain those who firmly believe that the central tenet of this view is instead inaccurate and that any surplus which may exist across the Cal 19 compliance year will be small and not sufficient to meet the needs of a liquidity float.
Underpinning this view remains an expectation of project commissioning and connection delays.
The reality is that a definitive conclusion to this debate may not be arrived at in the immediate short term, though many will be hoping that it is.
Yet the coming 2-3 months may however provide a clearer insight into whether cyclicality was a meaningful factor over the past few months or if instead it was the start of something bigger.
Small-scale Technology Certificates (STCs)

A steady beginning to the month of June led many to assume the spot STC market had seen its lows for the Q2 period and that the approach of the 28thJuly compliance date would yield progressively higher prices. The rest of June however turned that view on its head as the market instead lost ground.
With the spot STC market having closed May in the mid $38s and spent much of the first half of June at the same levels, the STC market was beginning to appear quite predictable to many on lookers.
As time went by and the Q2 compliance period approached, so the spot price would gradually increase they believed. Yet the second half of June brought quite different results, with buying interest waning and the spot softening back into the $37s on healthy trade volumes.

While there are those who focus on the softening market in recent weeks, there are others who believe it was instead a matter of prices having previously been too high as a result of the late squeeze for compliance buyers following the release of the Small-scale Technology Percentage on the last business day in March.
With a solid target having been announced and only a few weeks for buyers to purchase and acquit their STCs for Q1 compliance, the spot price soared through the $39.00 mark. When it eventually came back down in the final days of April and across early May, it appears many buyers opted to get on the front foot to avoid a repeat of April’s squeeze.
Having come to the market early, it appears demand for STCs dried up across the latter part of the month with many buyers happy to sit off and see where things went.
While May yielded consistency in STC submissions June was a little bumpier, yet average weekly submissions were up for the month despite the Queen’s birthday public holiday and the onset of winter.
The upward trend in submissions leading into winter which is usually a quieter time for installation activity may also be impacting on buyer interest levels with a strong winter likely to result in the STC surplus at the end of the year being higher than first thought.
Marco Stellais Senior Broker, Environmental Markets at TFS Green Australia. The TFS Green Australia team provides project and transactional environmental market brokerage and data services across all domestic and international renewable energy, energy efficiency and carbon markets.