The carbon tax repeal legislation received Royal Assent on Thursday, 17 July 2014. So, at the time of this writing, we now have over six weeks data to assess the response of Australia’s National Electricity Market.
And respond it has, with renewable generation falling by some 27 percent, and coal generation (particularly brown coal) and emissions up, compared to the equivalent period in the last year of the tax in 2013.

While the trends are entirely predictable, the scale of the response is staggering, magnified by uncertainty in carbon pricing policy. Apparently our borrowings on future emissions have been called, although not quite how you may think.
The context is that hydro had been generating at unsustainable levels during the years of fixed carbon pricing. Sensibly, hydro generators had exploited a window of opportunity provided by fixed pricing, assuming the price would either be zeroed out by repeal or that any future trend following a move to a floating carbon price would be down. Policy uncertainty had in effect made it economic-madness for our hydro generators not to ‘borrow future emissions’, to quote analyst Hugh Saddler.
With the repeal, hydro generation has dropped back by 26 percent to levels that are compatible with a more sustained longer-term outlook, and we are now paying back those emissions borrowed during the period of carbon pricing.
While there has been a significant return to fossil fuel since the carbon tax, renewable energy now plays a greater part in the mix than it did in the pre-carbon tax year of 2011. That is not surprising since there was then less existing renewable generation capacity in the mix, total demand was stronger, and there may even have been a bit of banking of future emissions. But it is clear from the figure above that the pendulum has swung well and truly back towards more emissions intensive generation.
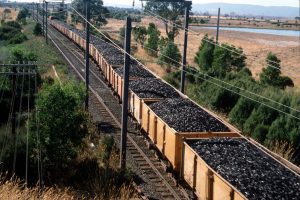
Worryingly, compared to the years before the carbon tax, the mix of the fossil fuel component now has a higher proportion of brown coal. In consequence, the carbon intensity of the fossil component of electricity supply has risen significantly, in large part cancelling out the emissions gains provided by growing renewable generation.
Before delving further into the details, a caveat is warranted. With only six weeks of data available, it is still far too short a period to be pinning all observed changes on the repeal. Over such short periods, variability in seasonal factors can significantly impact supply and demand, such as wind output. Thus, some caution is warranted in divining the full impacts of repeal at this stage.
That said, there have been some significant changes, as noted above and illustrated in the accompanying figures. Compared with the same six week period (20th July through 29th August) last year, notable changes include:
- a significant decline in renewable energy generation, down about 27 percent (1000 megawatts), due in large part to the decline in hydro generation (down 622 megawatts or 26 percent).
- a reduction in wind generation (down 378 megawatts or 30 percent), reflecting lower than average winds over the period.
- an increase in fossil generation (1083 megawatts or 5.6 percent), with a disproportionate increase in brown coal (624 megawatts or 12.3 percent) and gas (240 megawatts or 9.5 percent). In contrast, black coal is up only 218 megawatts or 1.9 percent.
- an increase in emission intensity by 6.9 percent (emission intensity up 0.057 tonnes per megawatt hour).


What does it mean for emissions outlook?
Compared to the previous year, the 6.9 percent rise in emissions intensity equates to extra 11 million tonnes of CO2 from the NEM, if output is maintained at current levels. However, given the downturn in wind generation is unlikely a persistent feature – perhaps just nature’s ironic joke on the repeal – we should guess the outlook will improve.
Factoring out the variability in wind contribution, and emissions intensity has risen at 5 percent (or about 0.044 tonnes per megawatt hour). This ‘structural rebalancing’ of hydro and brown coal generation equates to an extra 8 million tonnes of CO2 over the year, on an equivalent energy basis.


The rise in emission intensity will more than compensate any reductions in total emissions stemming from any likely, ongoing reducing demand. That makes it an odds on certainty that this financial year (2014-15) will be the first in six yearsto show a significant rise in emissions on the National Electricity Market.
More worryingly in terms of outlook, the way brown coal has compensated for declining renewable output points to the ongoing challenges. With increases due to international pricing parity expected to progressively price gas out of the electricity market, except as a peaking option, brown coal is in the box seat to pick up the slack, as it has with renewables since the repeal.
Without a price on carbon, it is clear we will need an effective policy mechanism such as a renewable or low emission target to mitigate the temptation of repaying our borrowings of future emissions with the most emission-intensive generation on the market.
Source: The Conversation. Reproduced with permission.