The view from the top – will the glow fade?

In the industry these days the forecasts of Bloomberg New Energy Finance are some of the most respected, and widely regarded as more realistic and credible than say the International Energy Agency.
Recently, BNEF has been somewhat pessimistic about the outlook for new renewable investment post those projects that are under way.
On the other hand new projects are still being regularly announced. Of course announcements are not commencements.
There is always a long list of project announcements and a much smaller list of actual commencements. Historically, AEMO used the term “committed” to refer to projects it expected to be built.
Normally, for us here at ITK to include a project as committed we required either an actual Final Investment Decision [FID] or at a minimum a Purchase Power Agreement [PPA]
A feature of recent announcements has been the scale of the projects and the capital commitments from offshore partners.
By and large Australian Superannuation funds continue to ignore the sector. We suspect many don’t even know what’s happening.
The projects on the attached table are not committed but they are on this list either because they are from very credible developers with a successful track record in Australia in recent years or, in the case of UPC, because they have received significant capital.
However, none of these projects are definite.

There are quite few significant projects that could be added to the list for instance Genex’s pumped hydro, solar PV, wind and battery.
For the record, here are the larger actual projects that are now fully commissioned in the past 18 months. Projects less than say 20 MW are not on the list.

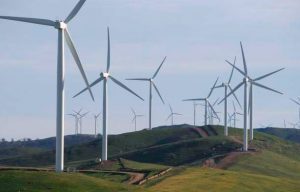
Heres the 3.2 GW of wind under construction or in some cases commissioning as I write. Commissioning projects include Sapphire and Silverton as far as I can tell.
The previous list had Nextif’s 90 MW Glen Innes project but I’ve removed that since it doesn’t seem to be going ahead.

Changes in ownership and names make following the PV project list something of an art form, but as far as I can tell the list totals about 2.7 GW

The largest projects are Bungala 220 MW and Sunraysia 200 MW. On that list Clare, Sun Metals, Bungala, Ganwarra, Griffith, Hughendon, Longreach are all in commissioning based on inclusion in the NEM Review generator list.
Names in NEM Review are official but don’t always correspond with the names in the table above.
The wind and PV still should produce in a full year about 16 TWh of energy or around about 8% of current demand.
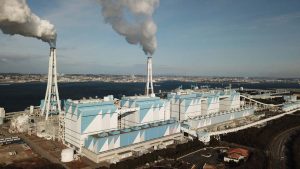
We’ve talked about the tension between price (renewables displace gas) and the NEG (renewables replace coal) before.
If we include rooftop P,V output is already hitting over 3 GW at maximum output, even in early winter and long before all these projects are up and running. Max PV output actually exceeds max wind output over the past 7 days

Victoria, QLD and NSW coal replacement to drive investment
It’s quite possible that there will, as BNEF suggests, be an investment pause, but the positioning of credible developers suggests that the industry at the least wants to keep its options live in case things continue to develop.
The immediate trigger is the 650 MW Victorian reverse auction winners, scheduled to be announced in July.
Your author is not a gambling man and reverse auctions tend to bring shock and awe on names and price, but if I had a flutter it might be on Stage 1 of Goldwind’s 350 MW Moorabool project to get a gurnsey. Road upgrades for this project have already started.
NSW coal replacements are also likely.
Again, we’ve discussed these before but below is a sketch of how much of the 18 GW of new renewable generation is required each year to replace expected NSW coal closures.
We estimate about $14 bn worth of investment over 17 years in present value terms. Development is steady in this concept but somewhat backended to allow for costs to continue to come down.

The market action – an average week
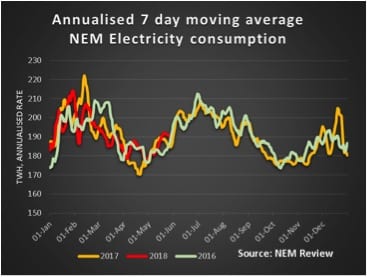
The past week was absolutely typical of a shoulder week in the NEM. Spot prices were close to levels of a year ago.
In fact the most remarkable feature of the spot prices is that we are now seeing several states, Queensland, South Australia, Victoria reporting weekly lows under $20 MWh. That hasn’t really happened since the Hazelwood closure.
Cooler weather seems to have driven volumes up a bit on the week. REC out year quotes remains soft. Spot gas prices are nudging up towards last year’s levels.
Electricity futures continue to drift with FY20 and FY21 off 1-2% in most States.
Internationally what we notice is that USA ten year bonds have dropped back below 3%. This is good news for renewable financing and the cost of capital.
Oil prices dropped but are still well up on last year. The implied contract price for export LNG is over A$12 GJ. Thermal coal prices in A$ at around $A 139/t will continue to put pressure on coal fired electricity profits in NSW.
It’s no wonder that Brian Flannery is looking to cash in on his half share of Delta.
We expect profits for that company to be well up this year and maybe next, and its Goat’s Hill pumped hydro project is arguably the best in the NEM but even so the medium term future for Vales Point will continue to be scrutinized.
We can see this by looking at analyst forecasts for AGL EPS which are off about 10% since the start of the year.


We already note the 19% lift in US$ oil prices over the year, but the USA 10 year bond continues to slowly rise.
Share prices
Lithium shares having been on the nose for a couple of months have staged a recent recovery. AGL has been one of the worst performing shares this year for reasons that are unclear.
As foreshadowed last week speculation lead to Tilt’s shares rising 11% on the week. Investors are yet to be convinced by Redflow and rising yields remains a concern fr APA and AST investors.


Volumes

Base load futures, $MWh


REC prices

Gas prices


David Leitch is principal of ITK. He was formerly a Utility Analyst for leading investment banks over the past 30 years. The views expressed are his own. Please note our new section, Energy Markets, which will include analysis from Leitch on the energy markets and broader energy issues. And also note our live generation widget, and the APVI solar contribution.