What’s interesting at the moment: “Devil’s in the Detail”
If 2017 was, for Australia, a year of price shocks and renewables investment – and internationally, the year the electric car started to really get attention – we expect 2018 to be a more cagey year.
Specifically, we expect about 0.75GW, maybe more, of wind to come on line, although mostly from the end of March onwards.
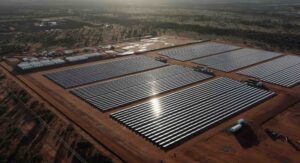
Possibly about 1.5GW AC basis of utility-scale PV will come on line, and with capacity factors essentially 2X rooftop PV that’s going to start showing up significantly in the middle of the day, particularly in Queesnland. The first stage of Genex’s Kidston plant is already producing, albeit at around 20MW.
Corporate PPAs
It should be obvious that corporate PPAs are tough to do. But they are clearly coming. The big integrated gentailers wish to exert as much control as they can on the markets. They do basically as little as possible in the way of new supply.
This leaves an opportunity for corporates who would like to take advantage of the lower prices that wind and PV can offer and wind and PV developers. The gentailer should be the middle man taking the aggregation and credit risk but they are stepping away from that role.
That’s why the Telstra/ANZ/RES deal for the 226 MW stage 1 of the Murra Murra wind farm is important. However we think that deal wouldn’t have been possible without the experience of RES and, even more important, James Gerraty of Telstra. This deals shows the potential… but can it be “codified” and generalised? A middle man that can put together lots of these deals might do well.
Headline grabbers
Of course the mainstream media are likely to focus on the more political and headline grabbing issues.
The foremost of these is the NEG. Because the NEG can be seen to offer anything to anyone (reliability plus lower emissions plus lower prices, if you believe the hype) the practical details of its strengths and weaknesses are just a step too far for most non professionals. And that’s why we will continue to look at the detail.
We will continue to monitor Snowy 2.0, but also note that it will be all talk in terms of impact for years to come.
We will continue to cast a critical eye on the AEMC. We increasingly think that the AEMC has management that has not had to sufficiently account for itself.
2017 was supposed to be about the battery. But it wasn’t, despite the 100MW installation in South Australia. The reason is that household battery prices didn’t change $1 and supply was limited. Most battery manufacturers have their eyes fixed on the car, bus, and bike market where prices did fall. According to BNEF a survey of 50 carmakers had prices at US$209 KWh (pack price) down 24 per cent from a year ago and an 80 per cent drop since 2010.
US $21/MWh record low prices for wind/PV + storage already making headlines
That said, perhaps the most exciting 2018 news story to date was leaked documents from Xcel energy on a solicitation of PV + storage for the State of Colorado. The PV bids (including ITC subsidies) were at $US29/MWh but there were 10.8GW of PV + storage at an average price of $US36/MWh. Wind plus storage was at $US21/MWh.
PV Magazine record low prices for PV and storage
These numbers are never quite as good in reality as the headlines suggest. We don’t know how much storage is included and the currency and ITC credits have to be allowed for. For instance the previous low the Tuscson Electric deal for 100MW of PV with 30MW/4 hour storage reported at $US45/MWh is probably $US90/MWh without subsidy ($A115/MWh). Tuscon report. Source: Utilitydive
Even so, the wind at $US21 – just supposing it translated at the same ratio – would be $A53/MWh which is still something to think about. Say what, did you say? $A53/MWh for wind plus some storage? Baby, that’s cooking! .
..Did somebody say cooking?
Will 2018 be the year of rising interest rates and oil prices?
Rising interest rates are a big negative for renewable energy as so much of the LCOE is driven by the cost of capital. So far though, although the changes at the short end look dramatic on a graph, they are really only a worry if you seem them as a harbinger of more change. Many forecasts look for as much as a 75 bps of rate rise at the short end this year. At the long end, if anything, rates have come down.
Fear of rising rates has driven a 10 per cent decline in the price of yield focused utility shares. So stay balanced and alert.

As for oil and coal, the rising prices there act to push up the cost of gas- and coal-fired generation in Australia. Export thermal coal is now around A$105/t and Tapis oil, the basis for LNG export contracts around $68/b.


Turning to the weekly action
Little change in 2018 so far from the end of 2017. During the week electricity volumes were down, other than in Queensland. Yesterday we had the very rare event of electricity consumption in Queensland being higher than in NSW. During summer, Queensland’s demand for electricity is extraordinarily flat on a day-to-day basis.
Spot price hit a high of $2468/MWh in Queensland and a low of -255/MWh in South Australia, but the YTD average of the two States is nearly identical.
Gas prices haven’t changed much.
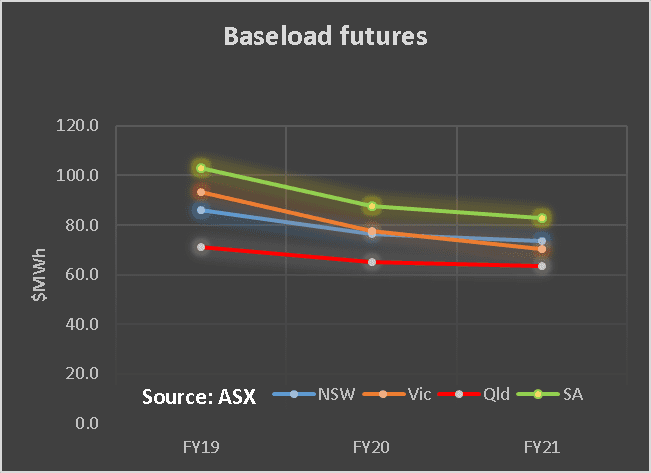
Electricity futures are flat.

Share Prices


Volumes

Base Load Futures, $MWH


Gas Prices


David Leitch is principal of ITK. He was formerly a Utility Analyst for leading investment banks over the past 30 years. The views expressed are his own. Please note our new section, Energy Markets, which will include analysis from Leitch on the energy markets and broader energy issues. And also note our live generation widget, and the APVI solar contribution.