Wholesale electricity prices in Queensland have gone through the roof, and the high prices have dragged up prices in NSW too.

As we have been commenting here for months, transmission issues have seen Victorian generators unable to access these markets, and even South Australia, running largely on wind and solar, is seeing higher average prices in recent weeks.
Still, the high prices in Queensland are remarkable, given that nothing in particular is happening to demand.

When we look at prices by fuel it’s a bonanza in Queensland, even for solar and wind, with current spot prices way above LCOE.
On the other hand, in Victoria, were these prices to continue and be reflected in contract prices, generators would be in financial stress all over the place.
For the last 30 days, the price obtained by solar farms in Queensland is averaging $88/MWh and wind is $102/MWh, while the corresponding Victorian numbers are $12/MWh and $25/MWh respectively. Maybe it’s Covid restrictions …

I’m too soon back from Xmas to work out exactly why prices in Queensland are so high, but certainly demand for coal for export isn’t helping.
These prices are maybe 3x or more what a coal generator in Australia would hope to pay in a medium term contract. The problem for Eraring and likely Vales Point in NSW, with no long-term contracts, is very obvious. However, in Queensland the situation is more complex and will need to be revisited at a later date.

Meanwhile, variable renewable energy marches on
Across the NEM wind and solar have provided 29% of total energy requirements in the past 30 days and 78% of South Australia’s requirements. These are strong numbers, albeit at a seasonally strong time.

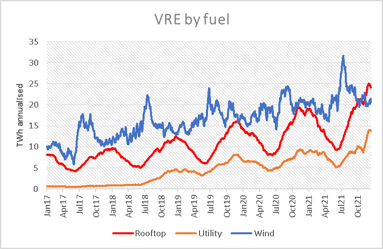
This year is starting with VRE (wind and solar) supply running at an annualised 10TWh above the level of last year.

This increase is entirely due to solar of one sort or another, wind production is pretty much flat year on year with rooftop solar production running clearly above wind for the first time in the history of the NEM. Indeed rooftop is presently the second largest fuel source behind coal.