Red on the screen! But that’s good news for consumers’ wallets. Futures prices and spot prices continued to weaken in the weeks to June 23, and gas prices were flat. The further North you go the more pronounced the effect. Share prices were also soft.
Despite a small reduction in subsidy (SREC) benefits, installed costs of PV in Sydney are down 6% over last year using SolarChoice data. Unfortunately, the Solarchoice sample has changed, making their June 2017 data hard to interpret. Other States are not that different to Sydney.

Turning to the weekly action
- Volumes: Flat overall but up in NSW. NSW volumes likely reflect the strong NSW economy more than anything else.
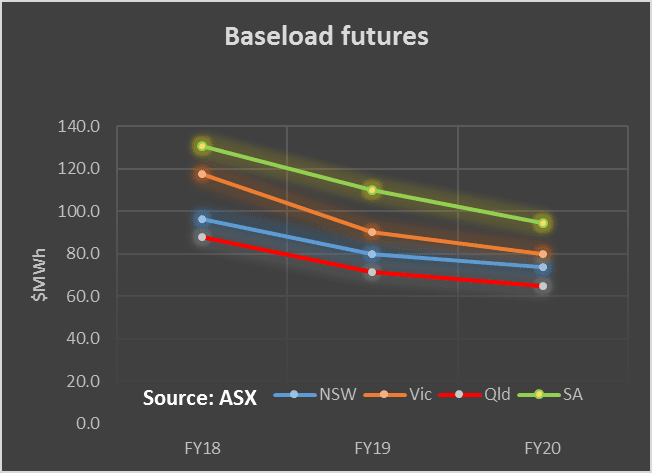
- Future prices These continued to fall. The fall was much sharper in QLD and NSW than in Victoria. This reflects most likely not just the new renewables but also the impact of Qld Govt. policy in asking Stanwell power to act to minimize prices.

- Spot electricity prices QLDs average price was $66 MWh and yes it warm and shoulder season but this price was lower than last year. QLD’s minimum half hour price was $21 MWh. We haven’t seen those lows in QLD for some time. The highest average for the week was Tasmania. Prices in Victoria remain high and will do until there is lots of new supply
- Gas prices . Gas prices were below last year’s level in Qld and South Australia and little up in NSW. That’s despite lots more gas generation this year particularly in Victoria. Magically more gas has been found to keep prices manageable. The next six weeks will show what sort of Winter peak we are in for. See Fig 14
- Utility share prices. “Sell in May and go away”, although originally intended for the European Summer seems to have spilt over to Australia this June with utilities shares lower over the week and month.
- Infigen had an earnings downgrade based on lower wind production in the June Quarter to date. We noted several days before that downgrade that wind production was very low this quarter, so it pays to read!
- Orecobre – a lithium producer noted that bad weather in Argentina had limited lithium recovery in the June quarter.
- TILT’s earnings outlook is soft for an infrastructure stock as noted previously.
- The Federal Government announced it plans to legislate to abolish most appeals from AER decisions to the Australian Competition Tribunal [ACT]. We note that whatever the reality of the situation the ACT’s rulings were upheld by the Full Bench of the Federal Court. We won’t be surprised if the network companies now appeal directly from the AER to the Federal Court. The network companies can hardly be blamed for seeking to have the law enforced. The real problem is the law itself. Energy markets are more or less self correcting. High prices are followed by low prices and vice versa as a general statement. Network prices are much stickier. In NSW where tariffs have more than doubled over the past 10 years, there seems little chance of them ever falling significantly under the current rules. As a result no matter what happens to generation prices households and business are going to continue to see an incentive to produce power behind the meter and increasingly add a storage option. In any event if the Federal Legislation abolishing appeals becomes law it’s likely a negative for SKI and AST and APA.
- The soft oil price is bad for ORG, its also a negative for gas exploration.

Share Prices


Volumes


Base Load Futures


Gas Prices


David Leitch is principal of ITK. He was formerly a Utility Analyst for leading investment banks over the past 30 years. The views expressed are his own. Please note our new section, Energy Markets, which will include analysis from Leitch on the energy markets and broader energy issues. And also note our live generation widget, and the APVI solar contribution.