Journey to zero emissions electricity: What happens when sun don’t shine, wind don’t blow?

This article is part two in a three-part series analysing the future of Australia’s electricity networks, and the federal government’s proposed National Energy Guarantee. You can read part one here:

Zero emissions power generation 101: implement policies that:

1) don’t make it hard for existing fossil fuel-fired power stations to retire,

2) don’t encourage the installation of any new fossil fuel fired-power stations.

In the first paper of this series we looked at the decarbonisation of electricity generation in Australia and the clear, compelling economics in support of renewable sources.

What we see is that ‘business as usual’ will result in the replacement of retiring coal fired assets with low cost renewable alternatives.

However recent concerns about the reliability of Australia’s electricity system given the ever higher penetration of solar and wind generation has led to calls for support for traditional ‘dispatchable’ generation – namely coal- and gas-fired power stations – to ‘firm’ the renewable generators.

This concern is best reflected in the most recent policy development – the National Energy Guarantee, with its call for guaranteed purchases of dispatchable generation.

While dispatchable generation could include pumped hydro or battery storage, the most likely options would be gas-fired generators at least in the short term.

However, requiring the purchase of electricity from dispatchable generators breaks both rules of ‘zero emissions power generation 101’.

It leaves Australia with residual emissions after 2050 from the remaining coal fired power stations (12 MT CO2-e) and the currently existing and new gas-fired generators (48 MT CO2-e).

In this paper, we consider the question of firming renewable generation over an extended period when ‘the sun doesn’t shine, and the wind doesn’t blow’.

The experience of the Tesla battery in South Australia has provided evidence that batteries can ensure system security and reliability in the face of generator failures such as a sudden shutdown of a coal-fired generator, or the passing of clouds over a solar PV array.

Further, a recent study that looked at Ireland’s electricity system demonstrated that batteries could stabilise a grid in a more cost effective manner compared to gas turbines.

However, the greater challenge is dealing with the loss of renewable generation capacity over a longer period that compromises resource adequacy and capability.

In these circumstances, the volume of energy that must be stored in batteries or in pumped hydro dams is significantly larger.

Modelling demand, supply and firming in a renewable energy zone

To explore the question of firming over longer periods, we constructed a model of a simple network consisting of two regional demand centres, separate dispatchable generators to supply the regions, and three renewable energy zones (REZ). The figure shows the configuration of the system.

The two demand profiles were derived from actual system demands in the NEM. The wind and solar profiles for the REZ were based on actual weather patterns in three sites spanning Queensland, NSW and South Australia.

The zones were chosen to ensure that the wind resources at the three zones were not correlated: when the wind was not blowing at one REZ, it was likely to be blowing at one of the others.

We sought to determine the volume of dispatchable generation required to meet demand given actual output of wind and solar farms in the three REZ.

We sized the wind and solar farms to minimise the overall cost of power generation. The overall cost of the system included the capital costs for the wind, solar, gas fired generators as well as the costs to run the gas-fired generators.

Table 1 shows the results of the optimisations for two scenarios.

The first scenario had only weak interconnections between the two demand centres and the REZ, restricting the contribution that the REZ could make to meet demand.

Further, the link between the two demand centres was limited. This scenario largely reflects the current NEM, with its limited intra-state interconnections and its focus on transmission from the large coal-fired power stations rather than the more remote renewable generators.

The second scenario has much stronger links between the nodes in the network. (All the data and assumptions used in the model are available on the Energetics website.  The levelised cost of electricity (LCOE) does not include the cost of any additional transmission infrastructure.)

Two features stand out.

First, the percentage of electricity supplied by the renewable generators is very high (note that we have assumed that short-term (battery) storage is available to stabilise the network). Secondly, strengthening the interconnections provides more options for the distribution of renewable generation and for optimising wind and solar resources.

The modelling suggests that the use of both wind and solar generators in locations with good resources and the installation of interconnections to allow renewable energy zones to support each other, will result in low-cost variable renewable generators meeting the bulk of electricity demand.

Is the key to realising high penetration of variable renewables a transmission system that is designed to support distributed generation?

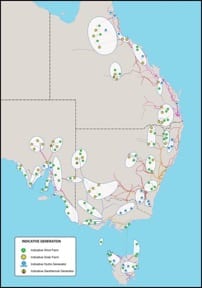
AEMO’s draft Integrated System Plan asks how large-scale renewable generation in targeted zones could provide an efficient solution for future power systems in Australia.

The draft ISP proposes renewable energy zones that are distributed throughout the NEM, as seen in Figure 2. Table 2 shows some of the correlations between wind resources, based on data from the Bureau of Meteorology for weather stations near the renewable energy zones.

Values at or below zero indicate that the wind resources are not strongly correlated.

With the wind therefore likely to be blowing at different times, they should be able to ‘firm’ each other provided the network can support the transmission of power.

“Integrated System Plan Consultation”, Australian Energy Market Operator, December 2017

The conclusion?

Distributed renewable energy zones with weak correlations, supported by a robust transmission network as flagged in AEMO’s draft ISP, offer a path to the effective deployment of renewable energy across Australia.

But what happens when the sun still doesn’t shine, and the wind still doesn’t blow?

This is the role of storage for energy shifting rather than storage for grid stability. Additional storage could provide coverage.

The results of a simple network model suggest roughly one day out of 10 there will be a shortfall in renewable energy for more than 12 hours of average demand.

The provision of sufficient storage to supply 12 hours of average demand would allow the renewable energy penetration to exceed 90%.

This storage could come from a number of sources: the underutilised battery capacity of electric vehicles, behind the meter storage in houses and commercial premises, utility scale batteries such as the Tesla battery in SA and large scale pumped hydro operations such as the proposed Snowy 2 system.

Back to ‘Zero emissions power generation 101’

To revisit my opening statements about the policy settings needed for zero emissions, we now have a third point.

“Decarbonisation of the electricity sector needs policy makers to implement policies that

1) don’t make it hard for existing fossil fuel fired power stations to retire,

2) don’t encourage the installation of any new fossil fuel fired power stations, and

3) ensure that the transmission systems support distributed generation.”

We look at the implications of these three requirements in the final paper in the series.

Dr Gordon Weiss is a Principal Consultant and Associate with Energetics. His expertise lies in energy and carbon policy development, renewable energy technologies and energy management in the resources sector. He has worked with a number of governments on the development of energy and greenhouse gas programs and policies, and is arguably one of Australia’s leading forecasters of emissions reduction trajectories.

Comments

51 responses to “Journey to zero emissions electricity: What happens when sun don’t shine, wind don’t blow?”

  1. George Darroch Avatar
    George Darroch

    This is slightly off topic, so excuse the question.

    It was blowing and the sun was shining yesterday. Wind reached 3.3GW in the NEM yesterday, compared to the 3.5GW from brown coal at the same time. Is this a record? Surely a marker which will be surpassed again soon with large amounts of new wind coming on.

    1. Peter F Avatar
      Peter F

      It depends how quickly the brown coal generators are repaired. There is nominally 4,700 MW of brown coal capacity so one could expect that by next summer when all the generators are back on line Brown coal will peak at 4,400 MW. By January next year there will be another 1,200 MW of wind on the NEM. Wind hit 70% CF on Sunday so that probably means wind will reach 41,100 on the best day in 12 months time but with Stockyard Creek, Murra Murra etc coming close after it is probably only two years away till wind beats brown coal for more than half an hour.
      The new wind plants in Tasmania will displace most of the Tasmanian export markets for Victoria and there will be cool sunny days where wind, solar and hydro in the 3 southern states will definitely out generate coal for local demand but then brown coal will resume its traditional role of propping up black coal in NSW keeping brown coal utilisation quite high

    2. David Osmond Avatar
      David Osmond

      Hi George, it was certainly a good day for wind yesterday, but I believe our current record for wind is 3.6 GW back on Aug 16, 2017.

      The record for wind + solar on the NEM was 7.2 GW last month on Feb 14, which comprised 3 GW of wind and 4.2 GW of PV.

      https://anero.id/energy/wind-energy/2017/august

      1. Malcolm M Avatar
        Malcolm M

        The winds were so strong they off-lined a couple of wind farms. Both Oakland Hills and Yambuk produced no output for a while because of Powercorp line problems that affected customers in Glethompson and Port Fairy. The Macathur and Ararat wind farms also had dips in output when the winds were strongest.

  2. RobertO Avatar
    RobertO

    Hi All, A lot of people argue against interconnects on the grounds that they are too expensive and provide too few benefits. Some claim that we should put all RE close to major users, but this put all your eggs in a small basket. Better to have new interconnects that pass through RE zones with lots of room for development area available. We need transport as part of the plan so over RE rather than under RE capacity is both desirable and useable (We can make H2 and we can even make CH4 (and we already have pipelines that can take all the CH4 we can make and using just H2 up to 10% by volume). Some people will argue that the efficiency of these process should be the drivers (put the horse before the cart not after it) not realising that the economy of the process has already been worked out (listen to any board room discussing a process, the first question is “Can we make money on this?” or “Will this save us any money?” After either of those questions have been answered in the positive “Yes”, (no boardroom will continue discussions on loss making process) will the question of efficiency be raised. A small increase in efficiency can result in massive profits..

  3. Peter F Avatar
    Peter F

    The weakness in this argument is focusing the generation in particular REZ’s. Recently Deloitte’s calculated that Holland could generate 59 TWh from rooftop solar. That means NSW, allowing for population differences, much larger building area per person and better insolation could supply 60-70 TWh from rooftop solar. In addition to its current installed or under construction wind and hydro and retaining its current gas generation for backup NSW could be more than energy self sufficient with little more large scale renewables, therefore very little need for more transmission.

    In fact an entirely plausible scenario using small local pumped hydro, waste to energy generator and consumer batteries combined with small French style wind farms of 3-10 wind turbines on the 22-66 kV grid could see far less power transmitted over the HV grid than there is today

    1. Hettie Avatar
      Hettie

      But Peter, those REZs were selected to have different weather patterns.

      1. Peter F Avatar
        Peter F

        When the cost of renewable generation was high it was important to put it in the most efficient locations and pay the transmission costs. Now that generation costs have fallen so much, it is more cost effective to put the generation at the load and reduce the transmission cost even if he generation is less efficient

        1. RobertO Avatar
          RobertO

          Hi Peter F, I think you have missed one of the main points in the article, “Strong Interconnects result in lower Levelised Costs of $76 and renewables at 78%. They talking about 5 states add perhaps 6 or 7 new interconnects some of which will be very short and the longest possibly SA to NSW and the shortest one’s being Vic to SA and Vic to NSW. Tas to Vic is in the middle.

          1. Peter F Avatar
            Peter F

            Strong interconnects are indeed necessary if generation is concentrated in REZ’s, but if generation is concentrated near the load then not so much.
            The 6 or 7 new interconnects you speak of could cost $4-7b. You can build a lot of local generation demand response and storage for that

        2. Ian Avatar
          Ian

          Sorry Peter, on a grid-wide level, how can you be sure? Are you referring to home solar and storage vs grid electricity, or on the NEM scale?

          We know there is many a profit twixt energy resource and socket!

      2. RobertO Avatar
        RobertO

        Hi Hettie, If you go to http://anero.id/energy/wind-energy
        Go to the page that shows all wind sites and remove all state and the total. Then add WRWF1 and MUSSELR1 and make sure SUBTOTAL is on. If you do it for daily or monthly it reinforces your point.

    2. RobertO Avatar
      RobertO

      Hi Peter F forget waste to energy as any sort of energy supply, if there built they are usually small in size, They will be less than 3 % of our average daily usage, and they are very expensive to build (and if you are building one your usually doing it for other reasons, the electricity is the by-product. I have been trying to get the board to give the OK for us to build one in the middle of Sydney.

      1. Peter F Avatar
        Peter F

        Robert I agree it is trivial on an annual basis but OC gas is normally trivial on an annual basis as well. In the US OC gas plants account for about 10% of capacity and run on average 10% of the time so produce only 2-3% of annual demand but are very critical at peak times. Waste to energy covers landfill gas, sewer and agricultural bio-digesters as well as municipal incinerators, straw boilers etc etc

    3. Malcolm M Avatar
      Malcolm M

      Did the Deloitte report simulate how much storage would be required for the rooftop solar to support a typical annual load profile? Here in southern Victoria (38 degrees south) our daily solar radiation ranges between 2 and 8 MJ/m2/d in winter, to up to 30 MJ/m2/d in summer. Holland is at even higher latitudes, so even greater seasonality of solar. I have run off-grid data-loggers here and if the load is too high, battery top-ups are needed in winter. The choice is either larger solar panels (which would lead to spilling energy in the summer), a larger battery, smaller load, or battery top-ups from a grid-based charger.

      At a grid level the equivalent choices are either more capacity of solar and wind (which would lead to occasional curtailment), larger storage, greater transmission between regions, or top-ups from fossil fuels. While southern Victoria has a strong winter dip in solar energy, there is virtually no winter dip from about Townsville north, so there are benefits in sharing. Wind here is relatively non-seasonal, and doesn’t balance the annual variability of solar. Storage involves both investment and energy losses (20-30%), while transmission also requires both investment and energy losses. So far there don’t seem to have been good studies of the optimum balance, apart from the studies of Andrew Blakkers. http://energy.anu.edu.au/files/100%25%20renewable%20electricity%20in%20Australia.pdf

      1. Mike Dill Avatar
        Mike Dill

        On a personal level, overbuilding makes sense to me. I can afford to ‘lose’ 5% of my rooftop production during the summer, so that I have bit more in the winter. Adding storage allows me to overbuild further, and supply further into the night.

      2. RobertO Avatar
        RobertO

        Hi Malcolm M and the optimum balance also need to include community benfits rather that just costs. And the community is “all Australians”, not just the rich (do we really want to buy everything from overseas, or can we do something here in Australia that stops the buying from overseas.

      3. Peter F Avatar
        Peter F

        Malcolm I find your posts very interesting. I agree sharing is essential, the question is how far. There should definitely be wind in the system because of daily and seasonal balance, but do we need to drag it halfway across the country.
        Take SA for example with about 900,000 small customers and maximum daily demand of 40,000-45,000 MWh at current loads. On a hot sunny day even with very low wind, utility solar and the solar thermal plant will provide over 12,000 MWh and wind at its worst will provide 8,000 MWh .
        That means it would need 20-25,000 MWh from storage/backup. If 30% of small customers had 5 kW/12 kWh that is 3,000 MWh. Large customers with 15-300 kWh round it up to 4-6,000 MWh from behind the meter assets.
        This leaves gas, on grid storage and interconnectors to supply 12-20,000 MWh on the worst possible day. There will still be 850 MW of combined cycle and high efficiency reciprocating gas capacity even if all the old gas generators and most of Torrens Island is closed. At an 85% CF that is 17,000 MWh without a single OC gas plant running leaving imports to be zero to 3,000 MWh. There is import capacity already for 15,000 MWh.

        If say 3 of the 5 proposed pumped hydro plants and 400 MW/1200 MW of new grid batteries were installed and SA carries on installing rooftop solar at the current rate imports will be trivial.

        Once Tasmania’s new wind farms come on stream, imports from Victoria will fall by about half and overall Basslink traffic will probably fall.
        In Victoria building to only 8% of the density of wind turbines and solar panels that Germany has today, combined with existing hydro could provide 90% of its energy.
        At peak demand then it would have existing import capacity of 2,200 MW, hydro of around 1,000 MW, wind and solar on a hot, low wind day of at least 3,000 MW, a total non thermal capacity 5,000-6,000 MW vs demand of 9,000 MW so again backup required of around 3,000-4,000 MW, roughly the existing gas capacity or 600,000 to 700,000 5 kW/12 kWh batteries. In practice a mix of existing gas, some new pumped hydro, batteries and demand response will easily do the job with existing interconnector capacity

      4. Peter F Avatar
        Peter F

        Re Holland, it did not answer that question re storage, but in Australia wind actually compliments solar very well, weaker during the heat of the day and summer and stronger at night and winter. You still have to have almost the same peak backup power but nowhere near as much energy. My rough calculations suggest 15 hours of peak day demand in addition to existing hydro would probably be enough across the NEM

  4. Malcolm M Avatar
    Malcolm M

    More batteries will enable our inter-connectors to be used more effectively. At present most inter-connectors are limited to less than half their thermal capacity because of the consequences of trips. However if sufficient batteries within each region provide a rapid (millisecond) response to both over-frequency and under-frequency, the inter-connectors could be used up to their thermal capacity. For example, yesterday afternoon when there were high winds in Victoria and South Australia, spot prices were negative in SA, $9/MWh in Vic, and about $60/MWhr in NSW. Export from SA to Vic was at its limit of 500 MW, from Vic to NSW at its limit of ~1000 MW, and from Vic to Tas at its limit of ~450 MW. Yet the transmission line thermal limits from SA to Vic are ~1150 MW, and Vic to NSW ~2300 MW. More than half the inter-connector capacity is not made available to the market, so that if one circuit trips the remaining one is not overloaded. But if the overload system were instead protected by batteries, we would be able to use the lines up to their thermal capacity.

  5. solarguy Avatar
    solarguy

    None of this article surprises me. I always said we can go 100% RE. Great article!

  6. Hettie Avatar
    Hettie

    A question. Does anyone know, and the BOM will have its info, though they would have to search for it,
    On how many days, since record keeping began, have there been no wind *and* heavy over cast over more than, say, 60% of eastern Australia – the NEM area.

    Because I seriously doubt that there have been any.
    When it’s overcast here, there is bright sunshine 100 km away. When it’s dead calm here, the wind is at 40 kph on the other side of the hill. When it’s overcast, it may be windy. When it’s dead calm it may be sunny. Overnight, the sun don’t shine – who knew!! But most human activity, business, manufacturing, education takes place in daylight hours. Not all, most.
    The key to energy security with renewables must be widespread geographic generation, a modicum of storage, and a Web of interconnections.
    Centralised generation and a few interconnects won’t cut it.

    1. Ian Avatar
      Ian

      You are absolutely right of course look at BOM for days of sunshine/ part sunshine and cloudy not very good for coastal areas but excellent only 50km inland. The wind output figures at https://anero.id/energy/wind-energy are very interesting. We just need to design the grid around the resource so simple really. You could sit in your armchair with a glass of red and in half an hour come up with a very reliable grid design. Just by looking at the BOM site.

      1. Hettie Avatar
        Hettie

        What a nice idea.
        Problems.
        1 Who in political power would take any notice of such a breathtakingly sensible design approach?
        2 Who would pay me for my design (someone was just paid $15,000 for two days), and how much?

        1. Ian Avatar
          Ian

          Why look for payment? Just have some enjoyment in the process of engineering your own designs and reverse engineering others. The more I look at this problem encapsulated in the idea of “prolonged windless, cloudy days” PWCD or “when the sun don’t shine and the wind don’t blow” the more I see Jay Weatherill’s ideas and implementations pop up and make sense. Too bad he has had his go and it’s back to the reactionary era.

          My original comment was aimed at understanding the extent of this PWCD problem . How would you define it? How would you put useful parameters to it to come up with a solution? Well my x, y and z for this is x = time periods, y = percentage of nameplate capacity and the z would be geographic distribution.

          Time periods are important for storage because large fluctuations over short times are easy for batteries to smooth-over. Large fluctuations over long time frames do occur for individual wind farms but do not occur over large geographic areas and aggregated wind farms and probably less so when adding in solar. Do check out the web site I posted above, it’s a graph of all the wind farms in the SE corner plotted individually for their percentage of nameplate capacity and the average percentage of the lot . Interestingly the aggregate does follow a sort of sine curve with a minimum of about 25% and maximum of about 70% and a period of about a day. The day to day change in minimums and maximums for the aggregate does not vary very much. Throw in solar in all its forms and then see how this aggregate behaves. Chop out some regions and look at the case for say one state like SA, how does the aggregate curve now track? Look at this curve in detail over a 5 minute period, zoom out for a day or a week , compare summer and winter, rainy season or dry. Fit in new regions that do not have solar or wind farms but simulate these using the amazing BOM data. We have very powerful tools here and it’s not rocket science. Should we build heroic interconnectors costing billions, use draconian demand management measures, build a sh-t-tonne of wind and solar, put batteries in every nook and cranny, drown fragile ecosystems with pumped storage dams. Well maybe, let the data be your guide!

          1. Hettie Avatar
            Hettie

            Payment because I’m poor.
            But all that maths is way beyond me. Plotting a series of windy spots and sunny spots would be as far as I go. And with lots of them, who really cares about whether point A scores 85 or 87 whatever; because points B to Z will be scoring 87 or 85,. Normal distribution curves and all that. I think. Well maybe not . And in any case red wine plays merry hell with my arthritis.
            Hic

          2. Ian Avatar
            Ian

            You are right, but there are lots of smart engineers with those computer-thingies that just need the boot of imagination and foresight planted on their motivation centres to point them in the right track.

          3. Hettie Avatar
            Hettie

            Well that’s good. Just not me. Still , it was a fun thought.

  7. Ken Dyer Avatar
    Ken Dyer

    What happens when the wind don’t blow and the sun don’t shine…..simple

    https://www.theguardian.com/environment/2018/mar/13/rain-or-shine-new-solar-cell-captures-energy-from-raindrops

  8. Ian Avatar
    Ian

    To aid this discussion regarding the problem of “sun don’t shine ,wind don’t blow” , time periods could be defined: for example 1second, 1 minute, 1 hour, 1 day, 1 week, 1 month. Secondly, percentages of nameplate capacity can be quantified : ie in a region like South Australia how often in a year would renewables out put drop to zero % for 1 hour or 1 day or 1 week? How often would the same resource drop to 75% or 50% for the same time periods?

    Our tools to mitigating generation fluctuation are 1. Storage, 2 excess generating capacity, 3. Interconnectors, 4. Demand management, 5. Diversifying resources. 6. Standby fossil fueled generators ( – the which should not be named)

    In a 100% renewables system we know that diversity of generator type and distribution can make for stability. The wider the assets are spread the more likely some of these assets will be operational all the time.

    Intuitively we know that zero renewables for 1 week is highly unlikely, but 75% renewables output for the same time period could occur occasionally. We also know that some small fluctuations occur frequently and a modest amount of battery storage can smooth this out, but the more prolonged decreased output is the real issue: Battery storage is excellent for the 1 minute to 1 hour time periods of fluctuating power supply, the FCAS market, and very good for daily time shifting renewables over a period of 24hrs, but, let’s face it, terrible at providing the very occasional prolonged power deficits.

    Well then , here are the pertinent questions 1. For a period of 1 week and a drop in output to 75% capacity, how often does this occur in a year? 2. How often would output drop to 25% for a week?

    If output drops to 75% for a whole week, then an over capacity of 33% will cover this shortfall without resorting to expensive large capacity hydro or large interconnectors. If periods of 25% capacity for a week occur 5 or 6 times a year then large capacity interconnectors may well prove cheaper than 4 times over-capacity of renewables installations. If periods of 25% capacity occur once a year or more seldom then perhaps standby gas or diesel may be the best option.

    My figures are purely for purposes of illustrating this concept . We already have the diversity of generators in South Australia and we already know how these perform. Now all we need to know is how much these need to be scaled up to achieve 100% renewables for 365 days a year , 300 days a year , 200days a year etc

    We might be very pleasantly surprised to find that week long 25% output events are very rare indeed.

    1. Ian Avatar
      Ian

      There is another principle to renewables generation – corollary of the idea of over-capacity: its okay to waste excessive wind or solar generation, we don’t need to use every last kWh of output.

    2. RobertO Avatar
      RobertO

      Hi Ian, so how are you going to get the 33% overbuild built. What company would build any RE if they are going to be curtailed all the time or even 25% of the tiime (we will need overcapacity). New Interconnects will lower the overbuild required, and more storage close to load will also help. Transport need to be added as well to the list as well.

      1. Mike Dill Avatar
        Mike Dill

        RobertO, well a RE resource running at nameplate capacity is something that only happens a few time per year. My solar panels get there two or three days per year. Overbuilding my array by 50% makes sense, as the total ‘wasted’ electricity from that ‘overcapacity’ is about 2% of total production.
        Same thing happens for wind farms. At least 80% of the time they are not running at nameplate capacity. I would be surprised if curtailment was more that a few percent.

        1. Hettie Avatar
          Hettie

          That surprises me.
          My 5kW system has frequent periods of producing 5.6kW. Biggest output for 1 day was a week ago, at 36.4 kWh. Bearing in mind that we are close to the autumn equinox, and the panels are fixed, not able to maximise output early or late, I am very happy.
          Right now, under patchy cloud, output is 3468W.
          Orientation is 4° west of solar north, which doesn’t seem much, but output is appreciably greater in the afternoon than the morning, and I do correct for daylight saving.
          Anyway, your main point, about overbuild, curtailment etc- wouldn’t the huge amount of rooftop solar feeding into the grid in the middle of the day provide much of the overbuild? Especially when more large scale grid connected battery comes on line? That seems to be an opportunity for a battery Co to think about, in localities where rooftop solar is abundant. Mop up the excess, smooth the duck curve. …
          Dunno. Am I making sense?

          1. Mike Dill Avatar
            Mike Dill

            Hettie, yes, your argument is sensible. In the winter your array will produce much less, and overbuilding makes sense, even if some of the summer electrons are excess to your needs.

          2. Hettie Avatar
            Hettie

            I’m very happy that the summer electrons have been surplus to my immediate needs. They have paid for my winter needs thruogh to mid June. Bought in power for dark days and overnight, plus the standing charge, is only 14 kWhs of FIT, about half of daily average output since early October. Winters here are mostly clear and sunny. Summer rainfall is high, winter is dry. Day length of course is less, but the difference at 31°S not as great as in , say, Melbourne. I look forward to the next 6 months with interest. From memory, midwinter sunset is close to 5 pm, sunrise about 7 am. 10 daylight hrs. Currently 12, of course. Equinox tomorrow, mid summer 14. Winter sun angle hits panels at around 90° at mid day too, so max efficiency. Wait and see.

        2. RobertO Avatar
          RobertO

          Hi Mike Dill Not Name plate but actual. Without new interconnects each state may require more RE than if we have them. Security come from local supply but reliability comes from well distributed supply i.e. some interstate. If you build local only then you need to build much bigger to cover the intermittent supply issues but better interconnects should result in less build and less intermittent supply. We still need Storage (all types), Demand Management (WA had it since 2001). One issue I have is “do we want to buy 20 million plus batteries from overseas (we have some 20 million vehicles and we are thinking how many household batteries).

      2. Ian Avatar
        Ian

        I see you’re an interconnect man, that’s good. Personally, I like the idea of robust interconnectors for the reasons you state: geographic diversity, opening up new areas for renewables development etc.

        I do have a niggling gut feeling though, that other measures like storage, demand management etc, might erode the business case for these.

        All cards should be on the table until the problem of intermittency is thoroughly understood.

        What might help interconnectors business case is the idea of large sites of renewables development along the route of the interconnector. That is certainly the case between Adelaide and Melbourne – lots of energy traffic along the way. The lovely arid areas between Adelaide and Sydney are also begging renewables development.

        1. Ian Avatar
          Ian

          There are other ways to look at grid reliability which may not involve the quantity or quality of the electricity on the grid: the following idea may disgust some, but here goes: In the era of distributed generation , storage and load management, the grid takes on a new rolê. It is no longer a supplier of electricity per se but a transport device or an electron highway. The grid poles and wires must be able to handle the import/export needs of a customer, but not necessarily provide clean, unlimited, always on tap electricity.

          With batteries and inverters behind the meter, how dirty and intermittent can you make the grid supply before homes and businesses suffer? Could you ,for example supply a rural town with electricity for 12 hours in the day sometimes at 45hz, sometimes at 55hz, the voltage varying between 80% and 120%, this would be fed through an electronic device coupled with solar, wind and batteries etc and come to peoples’ homes in the town 50hz, 24/7, 230V

          1. Peter F Avatar
            Peter F

            This is a huge opportunity. I first read dirty as coal fired but you meant poor power quality. I don’t know what the limits are but they are certainly broader than the existing ones. In fact if the system is designed properly you could actually get much better power quality to the end user than many Australian towns get now with already considerable voltage swings already

    3. Peter F Avatar
      Peter F

      If you assume that wind will run at 38%, tracking solar at 28-30% rooftop solar at 14% there will be some days like last Sunday where wind ran at near 70% and solar was above average while demand was low so that spare energy is used to charge storage, make ice, heat water, make hydrogen etc. some curtailment would be shared around but a wind or solar plant standing still costs even less than a gas plant standing and gas plants even now stand still for a lot more of the time than wind and solar plants do.

      1. Ian Avatar
        Ian

        Too correct. There are two instances when wind or solar “ stand still” 1. When the resource is lacking ie no sun ,or no wind and 2. Curtailment: too much sun and too much wind.

        Type 1 we can accept, type 2, much harder to stomach.

        The solutions to these extremes are surprisingly similar ( storage ,interconnection, demand management ) and number of occasions when either event is expected to occur would probably also be very similar – two ends of a Bell Curve.

        1. RobertO Avatar
          RobertO

          Hi Ian, Type 1 we can accept (NO WAY according to the NEG and the RWNJ whom want more coal power because its money for their mates). Do we really need 99.999 % availability of the network, with DM we can live with 99.9% (say 9 hr per year)
          On type 2 we have uses for excess generation so long as we can transmit it to a user (we need to realise that there are process that use cheap electricity, in large MW’s that need room to install and few people to work at the site and the good point is that the power does not need to be continuous), and there are other industries that can use continus supply that add the australian enployment

        2. Peter F Avatar
          Peter F

          That is exactly correct and fortunately there a lot of ways to shift load to avoid curtailment.
          1. The most obvious one is small batteries at the source which transfer sales from zero to peak price. A one hour 15-20% capacity battery will add about 7-10% to the cost of a windfarm, it will earn money every minute of the day through FCAS services and transfer about 10% of annual generation from near zero value to say $130/MWh.
          2. On site storage reduces pressure on the grid. A 300-400L hot water service running up to 85-90 C with a mixing valve can store effectively 3-4 days of hot water or 15-20 kWh for 1/10th the price of battery storage . Similarly ice storage for cool stores and airconditioning can actually reduce energy consumption by running chillers at night.
          3. The average electric vehicle will use 30-40 kWh per week. Even on a 7kW home or street charger, smart charging will easily find the 5-6 hours per week charging time to use up cheap energy when it is available

          1. RobertO Avatar
            RobertO

            Hi Peter F, on point 2, our systems are not designed for that Temp. We need a better insulated tank (and why are we limited to 415 Litre size when other in the world use 1000 litre tanks). Also the design of the Temp Relief valve and the Pressure Relief valve (They are a combo unit) are installed at the top of the tank. Puting in a seperate Pressure Relief Valve at the bottom of the tank is worth about 48 Kwhr / annum (SA had this regulation but not in the rest of the NEM).

          2. Peter F Avatar
            Peter F

            Thanks Robert. I understood that solar thermal tanks are designed for temperatures that high, but alternatively you could have a larger tank and lower temperature.
            My friend in Switzerland has a 2,000 L tank that he only heats to 40C or so to supply all the hydronic heating for his large house. It is heated by an air source heatpump which runs in the afternoon if the temperature is above about 2C so it can carry him right through winter, but keeping the maximum temperature lower makes the heatpump more efficient

  9. Norm Avatar
    Norm

    Solar works 24/7 when mirrors and a furnace tower generate steam .. excess steam is stored for night gen…this is working already… Search!!!
    If these ridiculous wind mills were cut off @ 50metres and thermal vortex generators mounted inside they would work 24/7.. could be mounted anywhere,, be a much less blot on the landscape ..much less susceptible to storm damage and safer for maintainable.. small more localised plants are more flexible in supplying the large grids

    1. Peter F Avatar
      Peter F

      Thermal vortex generators only work when there is a substantial thermal gradient and so still need backup. They actually occupy much more land area per MWh than wind turbines

  10. Norm Avatar
    Norm

    Also we would then not be buried under mountains of toxic batteries..

  11. Ray Miller Avatar
    Ray Miller

    Thanks Gordon for the article, although this is hardly new information as more then one Australian researcher has put forward similar research over the decades.

    As AEMO is starting to flesh out more detail to advance the energy transition the issues are more of optimization of the plan then in the past installing plant on casino basis of least resistance and maximum simple ROI, ignoring significant other variables.
    The energy transition plan will need an order of magnitude more refining, adding more energy efficiency and valuing other characteristics apart from geographic diversity and correlation factors.

    Every energy service will most likely need the treatment, from installing that western PV array in addition to the north, overbuild the array to inverter ratio to flatten some of the variable nature of systems. Using more onsite storage like super insulated hot water tank sizes to ride through more of those overcast days. Even changing fridge designs to store more “coolth” to ride though the peak grid usage and help with resilience for those times of short grid outage during natural events.

    Then we may even tighten significantly the thermal perform of our buildings to flatten the grid peaks in extreme weather events and even make them cheaper to run.
    We need more of an energy revolution than what has happened with our phones and computer laptops expanding into every energy service.

    We need to move on from just grandiose plans like Snowy Hydro 2.0 into a more refined plan with does take the advantages of geographic resource diversity and adds a significant measure of resilience as the climate becomes a tad more unfriendly.

  12. Peter F Avatar
    Peter F

    This is the key issue. California which has a very similar climate and economic structure to Australia uses 6.2 MWh/person/yr total demand including industry. Germany, 6.25, the UK 5, Italy 5, Spain 5.8. NSW 9.2. proper energy efficiency should reduce our demand by 30-40% just to catch up with those other countries

Get up to 3 quotes from pre-vetted solar (and battery) installers.