
We have lifted our wholesale electricity price forecasts across most states and categories, significantly, from prior estimates. This is mainly reflecting:
- Higher coal and gas prices;
- Less coal generation availability in all States;
- Slower arrival of new supply;
- Slightly higher demand due to a colder winter than last year;
The coal price, expressed in nominal A$, is at 10-year highs. This impacts NSW generators, even if there is generally lots of near-term contract protection. But, just as for electricity spot prices, these feed through to contract prices.
ITK sets the coal price for our long term forecasts at around the new entrant cost of new supply, which might be $US80-85/tonne allowing for environmental costs and for the highest spec coal.
As such we don’t factor current conditions into our long term forecast, but they do raise an eyebrow.

Despite the lift in the forecasts, our overall view remains that through to 2030 and a bit beyond the National Electricity Market (NEM) will basically be in over supply for the majority of the time, both for energy and power.
Prices will tend to be at or below new entrant prices, as policy forces new supply into the system ahead of thermal generation closures.
We broadly expect wind and solar, including rooftop PV, to be supplying about 130TWh of energy by 2030, approximately 65% of today’s demand.
However, that is on a scenario where projects are delivered on time, and there is only modest curtailment. It’s entirely possible that transmission delays continue and that the new capacity lags further.
Whether it’s 2030, or 2031, or 2032, will make a difference to electricity prices in any given year without necessarily changing investment or retirement decisions.
We estimate total utility-scale wind and solar capacity of about 35GW by 2030. Of that, we estimate 21GW is either operating or committed.
Our model allows for a further 14GW of new supply which is as yet unannounced, and of which 8GW will be requisitioned under the NSW energy road map.
ITK’s database, available for client inspection on our Dashboard by fuel, owner, stage of commitment and other criteria, has 7GW of utility-scale wind and solar either at the very early commissioning, construction, or otherwise committed stage. That is a further 10% of annual energy supply relative to 2020.

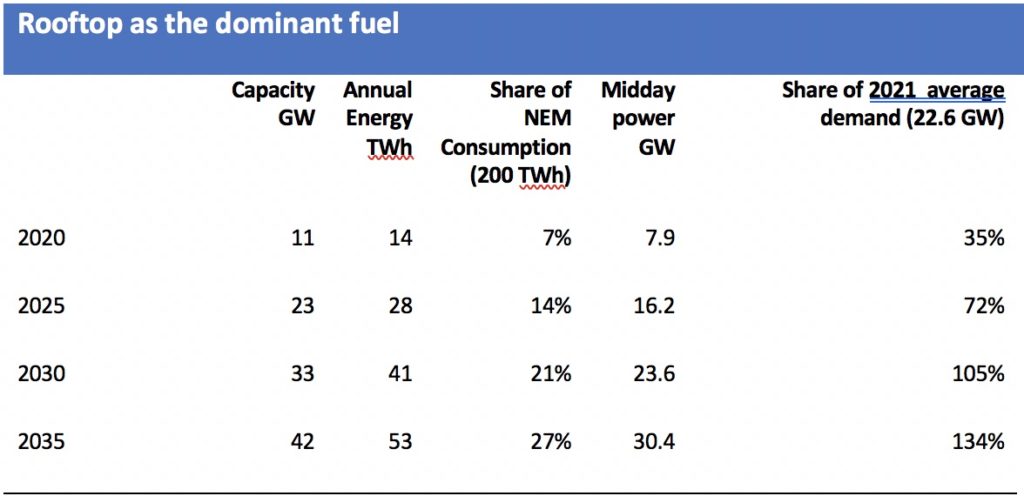
On top of that, of course, is behind-the-meter solar, which is expected to run at a 2GW-plus pace throughout most of the decade and contributing to very low middle of the day prices.
By and large, it’s that behind the meter solar that makes us pessimistic on the outlook for utility-scale solar projects going forward.
At least until Project EnergyConnect is complete, and because of the extended Callide outage, a somewhat surprising output from the model is that prices in the south – Victoria and South Australia – are expected to be below those in north. At least for the next couple of years.

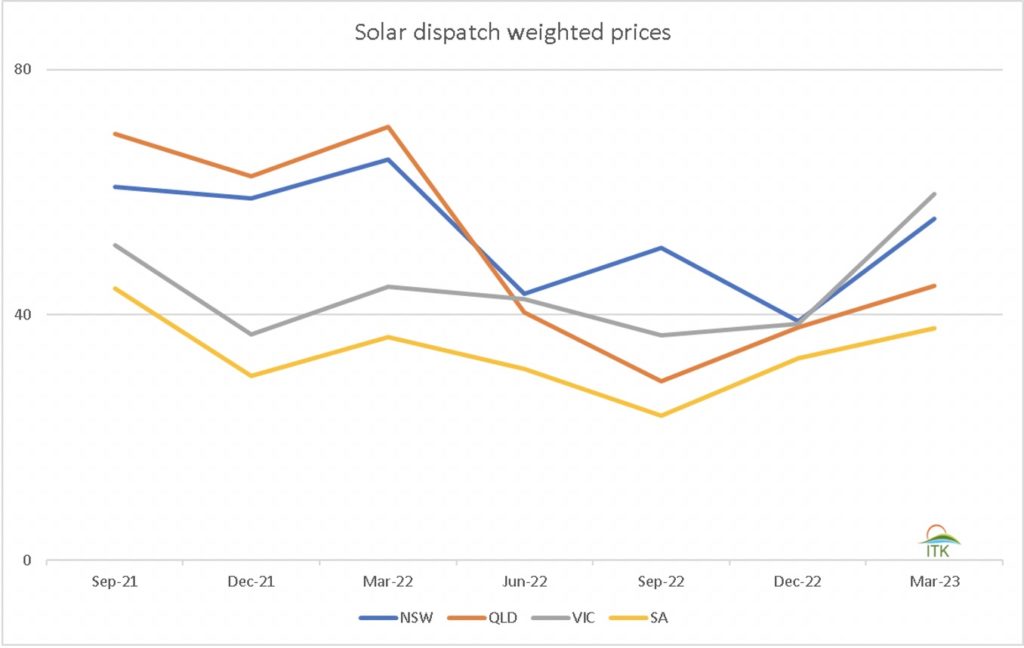
Quarterly price forecasts have also been lifted. The following figure is solar dispatch weighted forecasts quarterly:
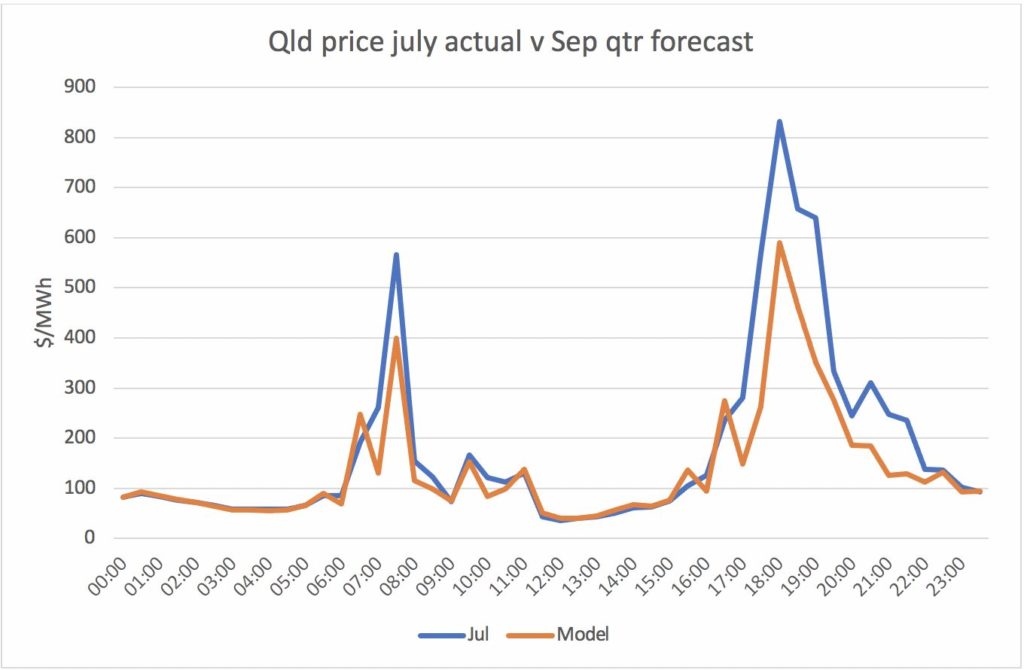
The following chart compares the actual average half hourly price in QLD for June 24 to July 25 with the ITK forecast for the September quarter. ITK provides quarterly forecasts for our own benefit as much as for out clients.
We use them to understand the strengths and many weaknesses of our Excel based modelling approach.
As a reminder, we forecast only down to the fuel level on an average over period approach use input assumptions as proxies for volatility and bidding strategies. We use parameters to reflect how much say coal to gas headroom will be used by the coal generation sector.
For instance, if the model outputs for a half-hour suggest coal demand relative to available capacity is high, then only a low part of the coal to gas headroom gap is modelled, but if not much coal capacity is available more of the head room is factored in.
We continue to see a better outlook for wind than for solar, at least out to 2030.
Beyond 2030 and the closure of Eraring, we are almost entirely in the area of speculation. Events in 2021 have shown how quickly near term forecasts can need to be strongly adjusted and as such longer term forecasts must be based on the underlying cost of supply.
As yet we have no real idea of how much energy will be required for hydrogen, or how much energy will be exported in the middle of the day from behind the meter capacity.
What we do expect is that prices in the middle of the day, longer term, will be driven by storage and that, therefore, overall prices will represent the weighted cost of bulk VRE production and the recovery of long-run marginal costs of zero carbon firming supply.