We anticipate that the final version of the 2022 Integrated System Plan will incorporate Victoria’s offshore wind targets. Just ahead of the release I’ve induldge my inner, but still junior burger nerd. I wish I had the maths to do this sort of thing better.
I want to take this opportunity and indeed every opportunity to talk about how useful the ISP is. In my opinion when the history of the transition is written, the 2022 draft ISP is likely to go down as the pivotal model for the transition. The one that irreversibly moved the dial.
And yet most mainstream political journos who write about the Energy Security Board and the capacity market machinations still would not even know what ISP stands for. It’s really, really incredible how far off the pace Australia’s political journalism actually is.
Anna Collyer, the chair of the AEMC and head of the ESB, writes in the AFR about the need for a capacity market, but not about the ISP.
To be sure Collyer is new and the ISP perhaps came too soon in her regime. And yet the capacity market prosposals are still incredibly vague and there is still no way to know the extent to which they will keep coal as compared to incentivising new dispatchable power.
By contrast, the ISP is into its second main iteration and has the benefits of a large team working on it for years, and has amazingly detailed methodology most of which is checked and cross checked in detail.
I personally think there should almost be a compulsory one day course “understanding the ISP” for anyone that wants to write about electricity in the NEM. A good start would be methodology document.
The draft ISP has accomplished four goals in my opinion.
The first goal it accomplished was to outline what inter regional transmission is required. That is ostensibly the purpose of the ISP.
The second thing it did was to show how a decarbonised NEM based largely around wind solar and DER work work to cost effectively reliably provide power and energy. i.e: prices wouldn’t change much and the lights would stay on.
The third achievement is possibly unintentional but arguably the most important. The document showed that at the time the industry stakeholder (govt, generator, retailers, consultants, NGOs) group strong majority concluded that the most likely scenario was the “step change” and indeed stakeholders are now mostly working to Stepchange.
I won’t go through stepchange outputs yet again but it doesn’t have a lot of coal or gas.
The fourth accomplishment was to put the industry back on a growth track. In Step Change, NEM electricity demand grows 40% to 2040 or about 2.3% per year. After a decade of zero actual growth that’s a welcome forecast and has important implications for retail and generators.
The ISP has lots and lots and lots of assumptions and of course most of them will turn out to be wrong, but those assumptions have been integrated into an overall forecast that is full of value and insight.
Not only that but virtually all the output and input data has been published at one point or another. Despite being a keen student, but possibly a slow read, it’s taken me, working on my own, the best part of a year to discover just how much is published.
Sure I’ve been working with the output data all year but I’ve just come to realise how much input data there. There are State by State forecasts of annual EV charging demand, half hourly forecasts of wind output, wind farm by wind farm and REZ by REZ, forecasts of electrification demand and so on.
In short there is enough data freely available to keep an analyst team busy all year. In what follows there is a bit of a first look at the portfolio benefit of Bass Strait offshore wind.
Offshore wind
The Victoria government’s offshore wind targets are:

The capital and operating cost are unknown but Bass Strait has historically been a difficult working area for say oil rigs. Based on UK and other data one could estimate about $m 4 per MW at least for the first 2 GW and perhaps $30/MWh for opex.
But what about the capacity factor and variability? Well AEMO in fact has published wind profiles for each of the prospective REZs including the Bass Strait REZ. It took me months to work this out but I am a bit slow on the uptake.
Then when you down load the file it doesn’t come with an instruction book. So I took a wild guess and interpreted every half hourly CSV as output of 1 MW in the location. For the halfhourly calendar 2021 wind trace this produced a capacity factor of 47% and a standard deviation of 73%. These numbers seemed about right. The standard deviation is a bit high compared to output from say all of Victoria but then its only one REZ.
We can compare say 2000 MW of Bass Strait wind with the existing wind portfolio as it performed in 2021.
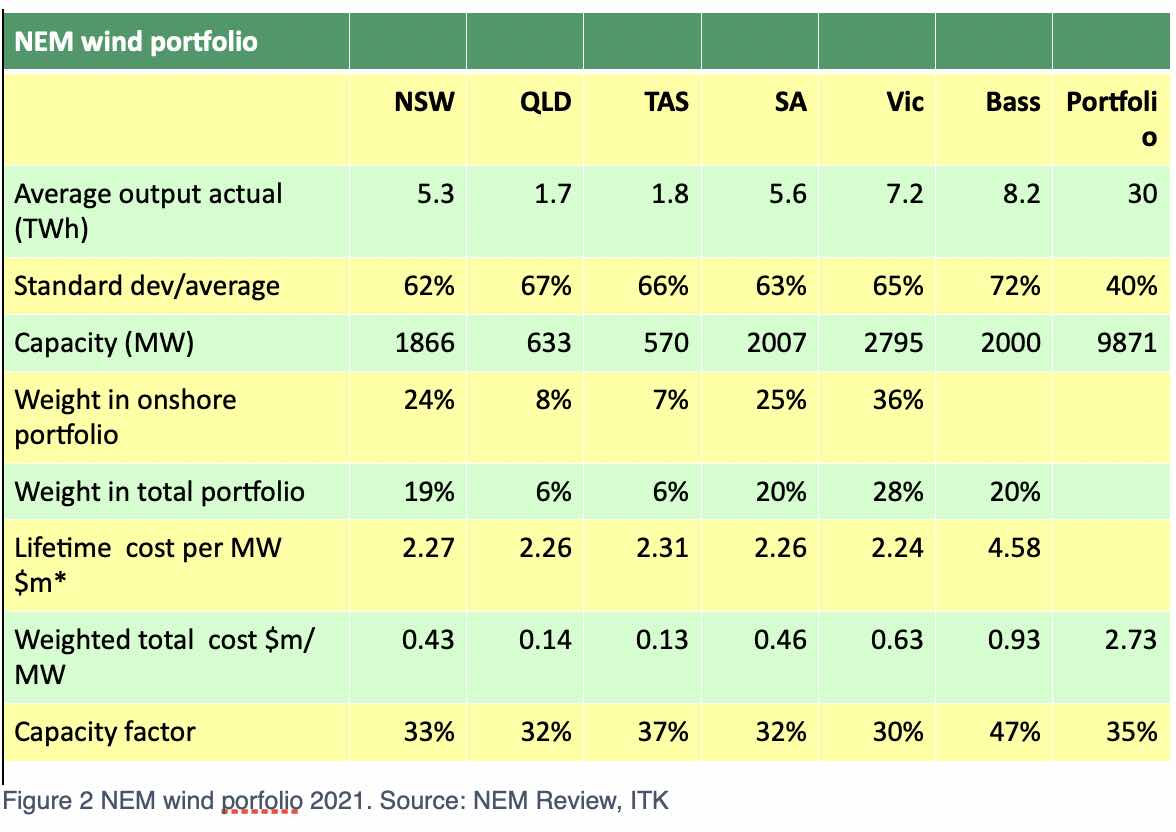
The life time cost is the capex + an estimated PV of opex over 25 years and then this is weighted by the region’s share of total capacity.
Then we could “normalise” the data by expressing every half of output in 2021 from the onshore States relative to average output for that State and compare an onshore portfolio with a portfolio that includes Bass Strait. Because we have normalised the data the average of each State is 1 and so the States are all equally weighted.
This figure hopefully makes it very clear that a portfolio is less volatile than the output of individual wind farms or even States and that Bass Strait wind even though it is more volatile in itself nevertheless lowers the portfolio volatility even compared to just the existing onshore portfolio.
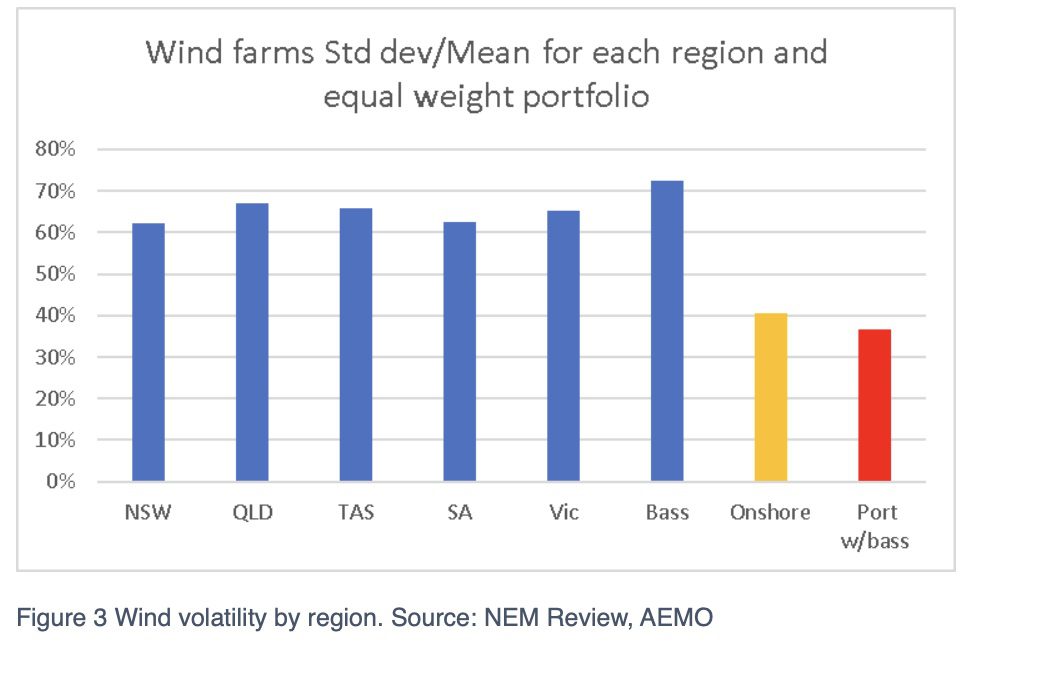
This portfolio effect is important because the less volatile a portfolio basically the less firming that is required. That is not quite true because the capacity factor is an even more important driver of firming.
The portfolio above is equally weighted but I was interested to understand what is the “optimum” amount of Bass Strait wind. I considered 3 things, lifetime cost, volatility and capacity factor.
To do the comparison I employed a standard concept from Finance theory “the efficient frontier”. This concept was developed by Harry Markowitz in 1952 and represent the efficient trade off between risk and return.
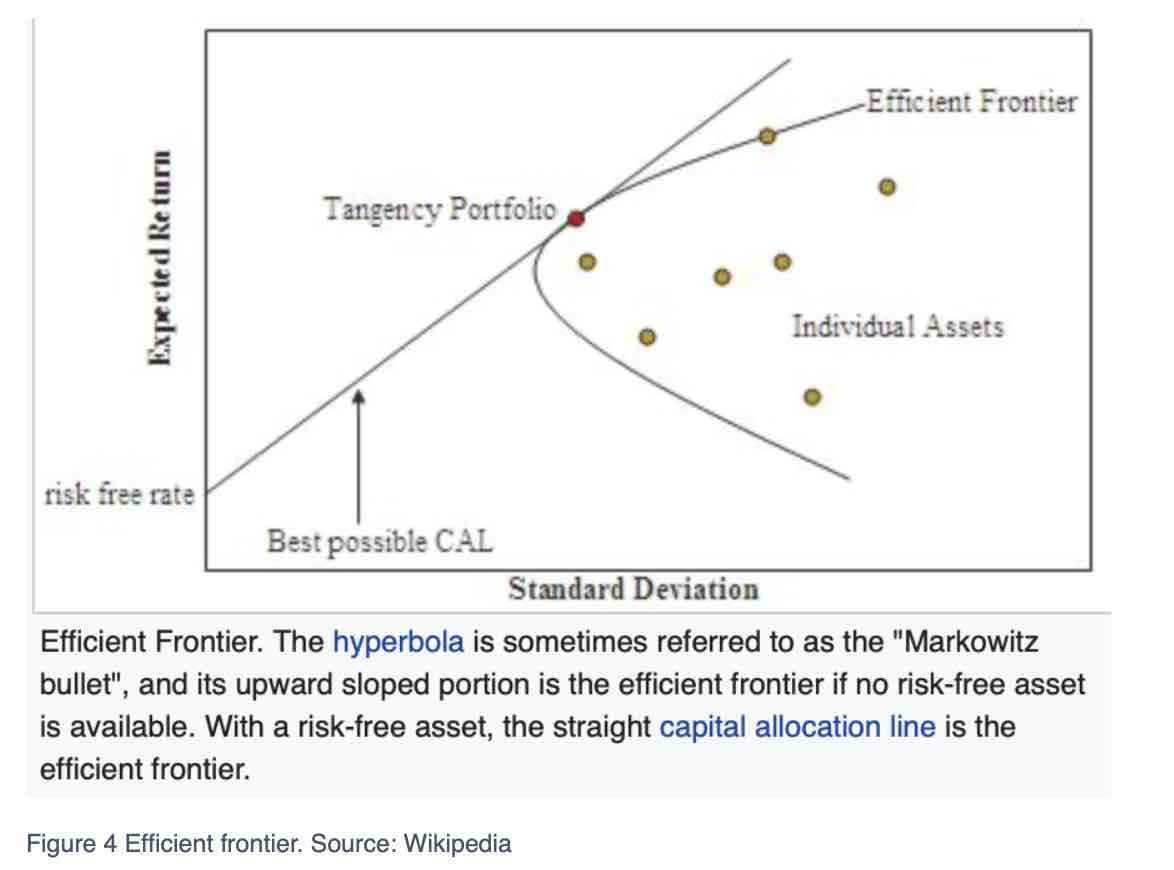
We know a lot more than in 1952 but nevertheless the same concept can be applied to the wind portfolio. Basically we want to find out the weights that will give an efficient tradeoff between the lifetime cost and the volatility.
To do this starting from scratch takes some work, but given my lack of maths skills, fortunately we don’t start from scratch. We have an existing installed base of wind and are just interested in how much Bass Strait wind to add in.
So I took the existing wind portfolio and added in various quantities of Bass Strait wind and calculated the portfolio weighted cost per MW (including PV of opex), capacity factor and Standard deviation (volatility).
When I ended up with something that looked like an efficient frontier for some reason it made me very happy.

The output table from which the graph was drawn is:

For my taste the sweet spot is around 2000 MW of Bass Strait wind BUT….
The ISP in its draft form models a big jump in wind installations to say 2035 particularly in QLD.
Using the MW currently modelled in the draft ISP for the various States and then calculating the portfolio standard deviation and lifetime cost/MW I get the following frontier.

In this case I would argue that there is only a very marginal diversification benefit going beyond 9000 MW of offshore wind in Victoria and that the slope of the line increases, ie the unit cost of diversification is increasing.
If you did pick 9000MW and used the ISP Step Change modelled wind outcomes then the overall wind output and capacity in 2030 would be:

Of course in fact the modelling outcomes with Bass Strait included will be different as less wind will be required in other States.
Also wind is just part of the overall model, solar has to be included, the cost of firming has to be included, the cost of transmission has to be included and the corrrelatio with demand has to be included.
The interaction with demand, in my opinion, is a reason to treat all outputs with care. That’s because demand is dynamic and like supply responds to price signals.
If electricity has a zero price in the middle of the day and is consistly hight in the current peak then over time we can be absolutely certain that some demand or supply adjustment will take place to reduce that difference.
That is in fact the greatest thing about storage it changes the possibilities. For the first time it is really practical to store energy to help to smooth out price or as the developer sees it to make a profit from price differentials. Not arbitrage as it’s certainly not risk free, but a judged trading profit.