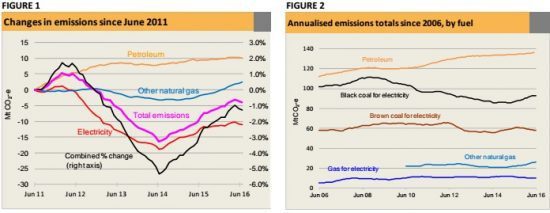
Energy combustion emissions covered by CEDEX accounting for 83% of Australia’s total energy combustion emissions (and 58% of Australia’s total emissions), steadily increased in the two years following the removal of the carbon price (Figure 1). For the first time since then, energy combustion emissions fell in June 2016. The absolute contributions of the main emissions components are in Figure 2.
The low point in the period since 2006‐07 for total Australian energy combustion emissions was in 2013‐14 according to the most recent National Greenhouse Gas Inventory (2013‐14). The emissions reported by CEDEX® were also at a minimum in the year ending June 2014.
The maximum reached since then was recorded in the year to April 2016; the increase from June 2014 was equal to 2.5% of national emissions from all sources in the year 2013‐14. The subsequent decrease to the year ending June 2016 has been a little under 0.2% of total national emissions.

As always, changes in emissions from electricity generation were the largest contributor to the changes in total emissions between March and June 2016. Electricity emissions accounted for 52% of total CEDEX® emissions in the year to June 2016, petroleum fuels for 39%, and natural gas used for purposes other than electricity generation accounted for 9%.
Note that on a total national basis, the electricity generation share of national energy combustion emissions is more than 52% because it includes emissions for WA and other electricity generators outside the NEM, which are not covered by CEDEX.
In addition to accounting for the largest share of emissions, electricity generation emissions change more rapidly than emissions from use of petroleum fuels and hence are usually the main drivers of changes in total emissions reported by CEDEX. However, in the year to June 2016, domestic consumption of petroleum fuels also contributed to the fall in energy combustion emissions. On the other hand, emissions from use of natural gas increased.
Petroleum
Trends in emissions from the main categories of petroleum fuels are shown in Figure 3.
Although the small scale of the graph makes it rather hard to see, sales of diesel, petrol and auto LPG have all fallen slightly. Domestic sales of aviation fuels and other fuels (mainly LPG) both rose slightly, the overall result is a small fall in total emissions from petroleum fuel combustion Though quite small, this is the most significant fall in petroleum fuel consumption since early 2014.

Figure 4 presents the same data in different combinations, with emissions from consumption of diesel sold in bulk separated from diesel sold through retail outlets. Most bulk diesel is used in off‐road activities, including mining, agriculture and rail transport. Most of the growth in consumption in recent years has been driven by mining (as discussed in the March 2016 CEDEX Report).
The data graphed here are net of the small volumes of diesel used for electricity generation in the NEM, but do include the somewhat larger volumes used for electricity generation in WA, the NT and remote off‐grid locations right across Australia.
Figure 5 shows bulk diesel sales by state. The contrasting trends in consumption in Queensland and WA explain the rather unusual trend shape of the national total seen in Figure 4. As discussed in March, the mining industry is the biggest single user of diesel. According to the statistics compiled by the Industry Department’s Resources and Energy Quarterly, annual production of iron ore in WA increased from 451 million tonnes in the year ending September 2011 to 825 million tonnes in the year ending March 2016. Hence the steady growth of bulk diesel consumption in WA correlates strongly with the growing production of iron ore.
However, the relationship between trends in bulk diesel consumption and mining of coal, Australia’s other major mineral commodity, is much less clear. Coal mining uses both diesel fuel and electricity for motive power: all underground mining uses electricity as does some open cut mining, but most open cut mining, particularly in Queensland, uses diesel.
These differences help to explain why, although coal production is only a little lower in NSW than in Queensland, bulk diesel consumption is much lower in NSW. However, the differences between the states do not explain the large decline in Queensland bulk diesel consumption in the past two or three years, since coal production has continued to grow throughout the period, albeit rather slowly.

The other striking feature of the petroleum data for the year ending June 2016 is the absolute decline in total volumes of road transport fuels sold, and hence of total emissions (Figure 4). As Figure 6 shows, over the past ten years there have been two previous periods during which road transport fuel consumption declined, though only one occasion when retail diesel sales declined. As discussed in previous CEDEX Report issues, the steady substitution of diesel for petrol in cars has been a key feature of this period.
In 2005‐06 the diesel share of total road transport fuel sales (defined in CEDEX as total sales of petrol and auto LPG, pus retail sales of diesel) was 14.6%. By 2015‐16 it had more than doubled to 30.4%. But over the three months up to June 2016, the share, calculated each month on a moving annual basis, became slightly smaller. Is the substitution of diesel for petrol coming to an end with improved availability of fuel efficient petrol cars along with increased attention to air pollution issues associated with diesel?
Natural gas
The estimates for natural gas consumption (other than for electricity generation), as shown in Figures 1 and 2, indicate that gas consumption, although a smaller contributor to total emissions than coal fired electricity generation and petroleum fuels , is increasing quite fast. The largest contributor to this increase is the gas being used at the LNG plants in Queensland.
All three plants use the ConocoPhillips Optimized Cascade process, which uses some of the input gas to fuel gas turbines, which provide all the motive power required in the plant, including powering compressors and electrical generators that supply all on‐site electricity requirements.
Independent reports suggest that total gas used in the plants equals about 8% of input raw gas. This figure has been used to estimate the gas consumed at the Gladstone LNG plants, and this quantity has been added to the estimates of gas consumption in eastern Australia for all other purposes (except grid electricity generation).
The result is that emissions for gas consumption over the past year or so are slightly higher than reported in previous issues of CEDEX® Report, and are growing faster, though growth can be expected to slow or cease when the two remaining liquefaction trains start operating (or sooner if operation of either or both is postponed, as some have speculated).
Hugh saddler is an energy analyst for Pitt & Sherry, part of The Australian Institute.