Western Australia electricity consumers would enjoy lower electricity costs – around $4/MWh (or 0.4c/kWh) less – with an 85 per cent renewable electricity grid in 2030 than they are paying now for highly polluting coal and gas fuelled electricity.
But the McGowan Government still has not even modelled or planned for a renewables-based grid for the South-West Interconnected System (SWIS).
The updated, refined scenarios outlined here also show that 85 per cent renewables is $6/MWh cheaper and even 90 per cent renewables is $1/ MWh cheaper than the most plausible Whole of System Plan (WoSP) 2040 scenario development by state agencies.
That pricing includes investment in new transmission and a zero price on carbon.
The current WoSP options have coal and gas thermal power stations operating out to 2040. Their lowest emission scenario has only 65 per cent renewable energy.
The plan would emit more than six million tonnes more CO2 per year than the 90% RE scenario and there would be more ‘spilled’ generation.
With a carbon price of $30/ tCO2e, the cost of the 2040 WoSP scenarios exceeds that of 90% RE by $11-15/ MWh. Note: Australian Carbon Credit Units exceeded $55/tCO2 in Jan 2022 and is now $30.
I have modelled four high RE and five WoSP scenarios, using SIREN and Powerbalance2 software (Table 1).
The results show significantly improved RE cost efficiency and more realistic WoSP costings compared to my previous quick and conservative modelling done in March 2021.

The refinements and updates are outlined in points 1-8 and the figures and tables:
- A more compact grid connecting to new RE zones in the south and SE (orange circle in Figure 1) comprising 250 km of new 330 kV transmission lines. Wind in the S and SE is needed to provide more energy during ‘wind droughts’ in the NW.
- In the SE around Broomehill and Kojonup.
- East of Collie and SE of Boddington.
- Connecting wind and PV farms to existing HV transmission between Pinjarra and Kemerton
- The new transmission cost estimate for the RE scenarios is $950 million. Length of new 330 kV lines not included in existing WoSP plans is reduced from 1400 km to 250 km. Twenty six collector substations (one per 200 MW wind/ PV farm), which are not included in the AEMO capex estimates, and three large substations are included. Annualized transmission cost is reduced from $5 to about $2 per MWh. Existing lines to the north, south and east are also fully utilized transmitting new wind and solar energy.
No new transmission costs are included in the WoSP scenario modelling, although there would be minor substation costs.
Federal Labor’s recent pledge to invest $20 billion into new transmission for RE would present a welcome opportunity for investment in links to new RE zones in WA.

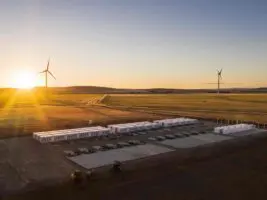
- All new wind turbines are assumed to be 4.2 MW like those used in Australia’s top performing Yandin wind farm, instead of the 3 MW units modelled before. They are 8% more efficient (Figure 2). Wind capacity is 4500 – 6100 MW in the RE scenarios and accounts for about 50% of energy generated.
Note: I also modelled 1200 MW of offshore wind NW of Bunbury in place of the onshore wind on the coastal plain. With fixed/capex costs 3.5 times that of onshore wind and underwater HV lines at 5 times the cost of above-ground transmission, this increased grid WALCOE to about $10/ MWh higher than with onshore wind.

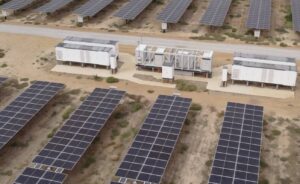
- A substantial amount of utility scale PV – about 2,500 MW in the 85% scenarios and up to 4200 MW in the 95% scenarios – is required to minimise cost of generation. The large single axis tracking solar farms are located in the high solar northern and eastern regions on existing HV transmission lines. This type of PV is much more valuable to the grid than rooftop units because it can supply energy when metro areas are clouded over, has a higher capacity factor and is more cost efficient to install.
- Rooftop PV in the Perth Metro area is limited to the cost efficient level of about 2,500 MW, after which excessive spillage in the middle of the day renders it less cost effective for the grid. There is already 1800 MW installed in WA and new regulations require all new rooftop PV installations to be remotely controlled by the grid operator. Capacity in excess of 2500 MW will be installed for self-generation, but will only be useful to the grid at times of energy deficit. In my view it should only be paid feed-in tariffs during these times.
- Combinations of large grid batteries and pumped hydro storage options are modelled. The 85% scenarios were modelled with 4 and 8 hour batteries and 2 hour batteries. The latter option requires 500 MW more wind and 200 MW more utility-scale PV capacity. To attain > 95% renewables, about 20 hrs of PHS is needed. PHS has 3-4 times the service life of batteries and would be more cost effective in the long run if suitable sites can be utilized.
- The open cycle gas turbines (OCGT’S) costed in all but the 2021 scenario are ‘aeroderivative’ units, which are more efficient but more expensive than the larger ‘main frame’ type. Some of the existing larger units could be maintained to deploy during those rare evening hours of energy deficit. A few may be converted to synchronous condensers to assist grid forming battery systems with reactive power and frequency control functions (not costed in any of the scenarios).
- A small amount (100-200 MW) of biomass fired steam thermal generation is included in the RE scenarios, to assist with ‘grid forming’ and winter energy. The plants are expensive to build but the fuel – municipal and plantation waste – is assumed to be zero cost. There is also great potential to use biogas and bio-oils to fuel OCGT’s in future but that is not modelled here.
- Demand management is kept below 1200 MW – less than 30% of hourly load – and only about a quarter of it is more than 500 MW.
- For the 85% RE 4/8 hour battery scenario, DM is only needed for a maximum 90 hours per year between 5 and 10 PM on about 20 cold winter days and a few hot summer days.
- Hours of DM fall to 73 and 18 hours in the 90% and 95% scenarios.
- This is much less than the 1600 MW/ 256 hours required in the 2040 base case scenario.

Input assumptions:
- Technology capital and fixed costs for all technologies except coal are from AEMO, 2021 Inputs and Assumptions Workbook ‘Central’ scenario projected costs for 2025-26
- Battery storage and utility PV are cheaper than the 2018 costs used previously; wind and gas turbines are more expensive.
- Coal power station capex as per actual published figures; zero for Muja as it is more than 30 years old. Fixed costs for all coal units are doubled due to frequent ramping and start-up stresses in the WoSP 2030 and 2040 scenarios.
- Cost of capital 5.9% for all technologies and 5% for transmission lines. Amortization periods are 15 years for batteries, 25 years for wind and solar and 30 years for all other scenarios.
- A gas price of $7/ Gj and coal price of $3.06 assumed for all scenarios. A gas price of $5/ GJ was also modelled but did not significantly affect the relative order of LCOE’s.
- Demand is set to enable direct comparison of WoSP and RE scenarios in 2030 and 2040 (Table 1) :
- 35*2014 demand for the 85% RE and two WoSP 2030 scenarios.
- 66*2014 demand for the 90% and 95% RE and two WoSP 2040 scenarios
- RE capacities of the two ‘Techtopia’ scenarios have been scaled down accordingly, while capacity of the coal and gas generating units retains the same.
Note: The costs and capacities are modelled using wind and solar data for a poor wind year (2014)’ The scenarios were re-run using data from a good wind year (2017), which gives 2-3% higher percentage RE, hence the range shown in the tables.
Conclusions
The WA Government’s WoSP is designed to keep gas and coal thermal generating as long as possible.
This satisfies the wishes of bauxite and other mining companies to avoid management of their demand and enables them to keep selling their excess fossil fuelled energy into the grid.
But this plan does not satisfy either the wishes of the majority of voters in WA or the global imperative for net zero carbon by 2050, which has been underlined by recent IPCC reports and global climate disasters.
Build-out of wind and utility PV needs to resume immediately after the hiatus of the last 2 years, aiming to reach 85% by 2030.
Government should close the State-owned coal fired generating units as soon as RE comes on line. It should also plan to stop paying capacity credits to the steam thermal power stations when enough RE is deployed.
The mine-based gas cogeneration and CCGT generators along with Blue Waters coal power station will then have to close or be used only for on-site back-up.
In the past 12 months the need for energy security has come to the fore. Due to the Russian invasion of Ukraine, most nations now see the need to reduce reliance on fossil fuel imports.
Australia is particularly reliant on imported oil, petrol and diesel and as we have seen in the past two months, susceptible to oil price shocks. A renewable energy based grid is essential to decarbonize electricity, transport and industrial processes and provide energy security.
Ben Rose is a Perth-based energy and emissions analyst.