The International Energy Agency has recently published its new report Renewables 2017, which received maximum coverage around the world for its argument that solar PV is now growing faster than any other energy source.
Yes, the IEA report made a point of documenting the strength of the shift to solar power, and of raising the IEA five-year projections for the contribution of solar PV to power generation by the year 2022.
But what the IEA did not reveal clearly in this report is how strong is the green shift overall in global electric power generation.
The data provided by the IEA in the report can however be analyzed in a way that illuminates the trend, as we demonstrate in this posting.
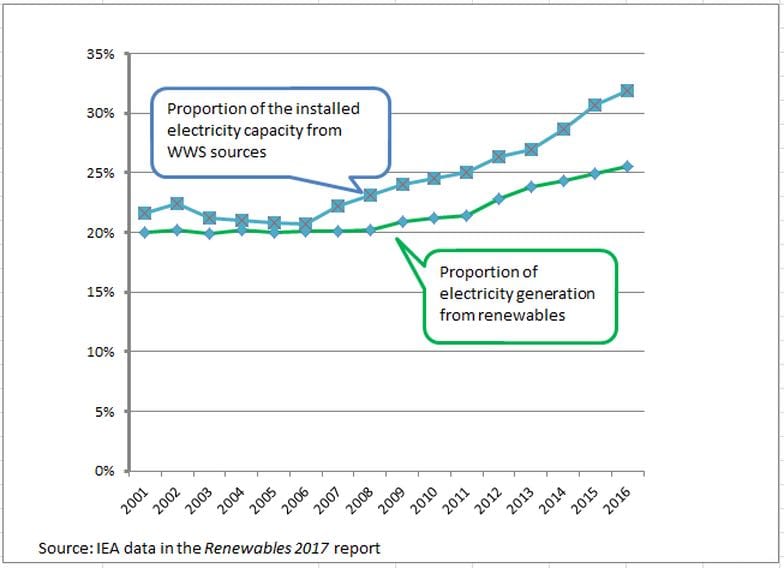
Chart 1. Global electricity capacity 2001 – 2016: Proportion sourced from WWS

Consider Chart 1, which documents the changing character of global electricity capacity over the past decade and more.
The IEA themselves document the changing contributions, as global power capacity comes to total 6,700 GW in 2016.
Coal is still the dominant fuel, accounting for just over 4,000 GW capacity and is still rising. But when the contributions from water, wind and sun (WWS) are added together and plotted over time, a clear trend emerges.
The average rate of increase is 11.1% year-on-year during the period from 2001 to 2016, which is extraordinary enough, but even more remarkable is the shift towards WWS over the course of the past decade – up from 21% in 2006 to 32% in 2016 – or an 11% global green shift in a decade.
Moreover the proportion of electric capacity sourced from WWS has been increasing every year since 2006.
By contrast the IEA sets the global level of nuclear power capacity as just 400 GW, neither increasing or decreasing – and vastly outranked by WWS, which reached 2000 GW in 2015 and rose further to 2,100 GW in 2016 (i.e. 5 times the level of nuclear capacity).
It makes all the difference to extract the data for WWS contributions and to plot them over a decade. It is this procedure which brings out the true enormity of the global green shift that is transforming the world electric power sector.
Chart 2 performs a similar operation on the global electricity generation data. Here the world’s total electric power generation reached nearly 24,000 TWh in 2016 (i.e. 24,000 billion kWh, or 24 trillion kWh), growing at 4.2% a year on average.
Again coal is the largest source of fuel, accounting for nearly 10,000 TWh, while WWS sources have now overtaken gas and accounted for over 5000 TWh of electricity generation in 2016.
But it is the shift in proportion of electricity generated from WWS sources over the past decade that is of interest, with the proportion rising from 20% in 2007 to 26% in 2016 – or a 6% shift in the decade.
The shift in terms of electricity generated is not so marked as in the case of electric power capacity because of the differing levels of electric generating potential across the different energy sources.
Chart 2. Global electricity generated, 2001 – 2016: Proportion sourced from WWS

In Chart 2 we plot actual electric generation results together with IEA five-year projections up to 2022.
It is notable that the IEA sees WWS sources as rising from just over 5000 TWh in 2016 to over 8000 TWh in 2022 – a considerable enhancement on previous five-year projections for renewables made by the IEA.
If the projections were made in terms of exponential increases in WWS sources and comparable rapid plateauing and decline in thermal sources (with WWS sources crossing over and exceeding coal as source before the year 2022), the chart would be even more striking.
Which country is driving the global shift?
The question arises: which country (or countries) has been driving this global green shift in electric power generation? The answer is clear as soon as we look at the comparable charts for China. We carried these charts in the earlier blog posting, but reproduce them here for ease of comparison.
Chart 3 reveals that the proportion of China’s electric power capacity sourced from WWS rose from 20% in 2007 to 35% in 2017 (1H) – or a 15% swing in a decade.
And the shift is of exactly the same form as the global shift revealed in the IEA data, making it an inescapable conclusion that China is the driver of the world trend.
Chart 3. Change in proportion of electric power capacity sourced from WWS, China, 2001 to 2016 (and 2017 1H)

A similar trend but one that is less accentuated is revealed when we look at the chart for electric power generation, as in Chart 4.

The chart shows the total power generation in China rising from less than 1000 TWh in the early 1990s to 6000 TWh (or billion kWh) by 2016 – by far the largest such national total in the world.
A clear inflection point at the year 2001 is evident — when China joined the World Trade Organization.
The red stippled line shows electricity sourced from coal and other fossil fuels rising in step with the total generation up until recently, when it becomes ‘capped’ at 4300 TWh. The chart indicates that this cap is unlikely to be exceeded – ever.
Meanwhile power generated from renewable sources – WWS – is shown in the blue line which rises at the lower end of the chart, to reach 1500 TWh by 2016 or 25% of total power generated.
The bold line shows this proportion steadily rising, with some temporary upturns and downturns associated with hydro availability, rising from 15% in 2007 to 25% in 2016 – or a 10% green shift in a decade.
Almost all of this is due to increases in power generation from wind and solar PV sources. The contribution from nuclear is shown at the very bottom of the chart – it is insignificant.
The comparability between the chart for electric power generation globally and that showing the situation for China reveals that China must indeed be the driver of the global green shift.
Indeed the fact that the shift in China is more accentuated than in the global case reveals that China is indeed driving the global shift – not the other way around.
When the two curves for China (showing capacity sourced from WWS and electricity generated) are placed on the same chart, we have the situation shown in Chart 5.
Chart 5. Proportion of electricity sourced from WWS in China: Capacity (blue) and electricity generated (green), 2001 — 2016

In Chart 6 we demonstrate the same two curves for the global level, sourced from the IEA data in the Renewables 2017 report.
Chart 6. Proportion of electricity sourced from WWS for the global level: Capacity (blue) and electricity generated (green), 2001 — 2016

Finally, to really drive home the point, in Chart 7 we place the Chinese capacity trends against the global capacity trends, in terms of proportion of capacity sourced from WWS. The chart reveals clearly how the global trend follows the China trend – further strengthening the argument that it is China’s renewable energy choices that are driving the global renewable trends.
Chart 7. China vs global capacity trend, 2001 – 2016: Proportion of electric capacity sourced from WWS

This posting has two main conclusions. The first is that the green shift in global power generation is strong, enduring and inescapable – as revealed by the sharp upward shift in proportion of electric power capacity sourced from WWS over the past decade (with an 11% swing from 2006 to 2016) and the comparable (if less emphatic) shift of 6% in electricity generated from WWS sources over the same decade.
The second major conclusion is that the clear driver of the global shift is China, whose pattern of green shift towards WWS sources for both electric power capacity and for electricity generated is identical to that revealed globally by the IEA data.
That the green shift in China is more accentuated than the global level reveals that China is indeed driving the global shift, rather than being driven by it. These are profound conclusions that characterize the state of the world in 2017 and the likely developments over the next five years.
Acknowledgment: My thanks to Ms Carol Huang for assistance in preparing the charts. This article was first published on John Matthews’ blog Global Green Shift.


