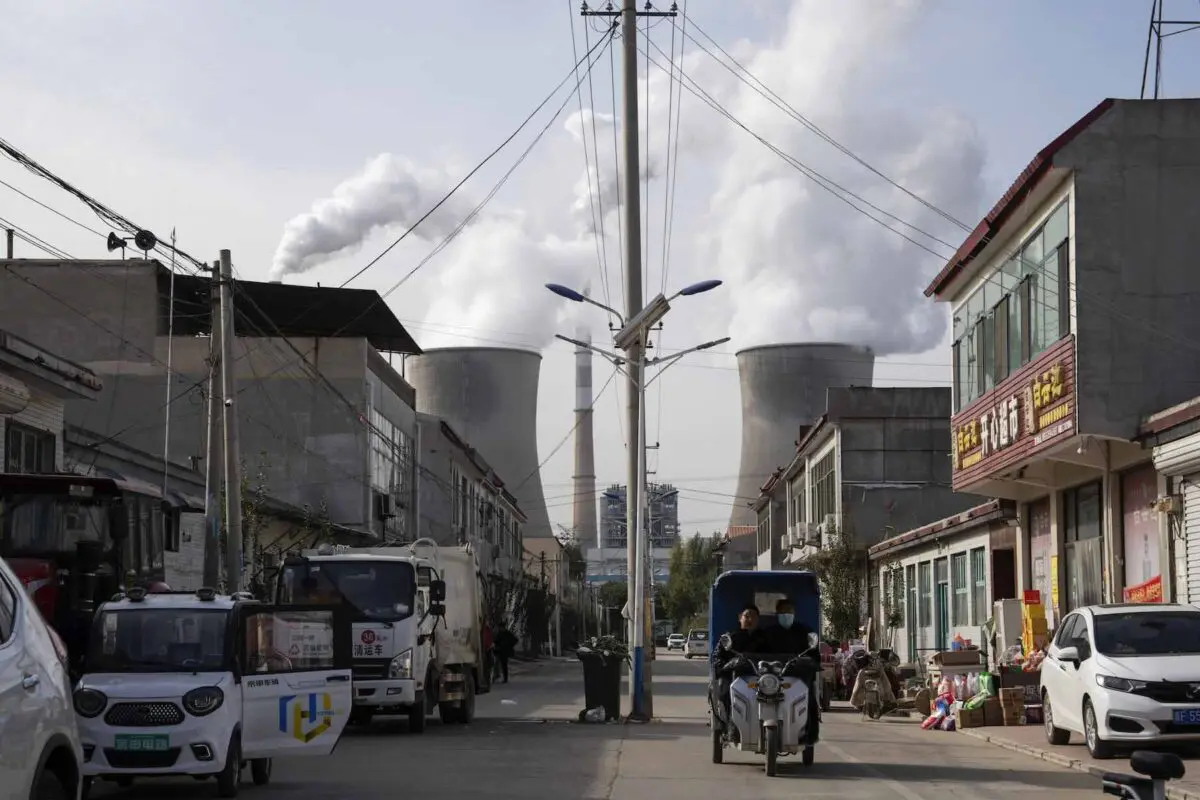
China can still develop new coal at less than A$100 a tonne, but only from its shallow Ordos rung, and that rung has about 25 years left at current output.
Everything below it is deeper, more remote, lower rank or smaller, usually several at once. Capacity under construction will hold the price down for a few years while the resource behind it gets worse.
I expect underlying returns to fall unless the coal price rises in which case substitution happens faster. In the very end producing close to 5 billion tonnes a year of coal in one country means shifting production from one region to another region raising costs and will end badly.
Other regions round the world, Wales, Spain, Germany, Virginia have also seen coal production die away with large social impacts, often 100s of thousands of people have to retool.
China can put that off by reinventing coal but it can’t hide. Increasing production brings the end faster, but for the world the challenge is the increasingly severe outlook for global warming.
China’s coal production and burning, and I repeat this later, will be responsible for about 14% of global climate changing emissions between 2026 and 2040, maybe a touch less. It remains a variable we should all focus on.
China has something for everyone
As anyone following the sector knows, China is by far the major manufacturer of the equipment the world needs to decarbonise. It makes most of the solar panels, many of the wind turbines, most of the batteries, most of the EVs, most of the electric mining equipment.
China deploys some of this equipment at home, to progress both its own decarbonisation and its own strategic interests. It also exports much of what it makes, and that is what makes decarbonisation affordable elsewhere.
That said, China is also by far the largest contributor to year by year global emissions. Mining and burning its coal runs at about 10.9 Gt of CO2-equivalent a year once coal mine methane is counted.
Against a global total of 78 Gt on the same basis that is 14%; counting only CO2, against a CO2-only global total, the share is comfortably over 20% (Figure 17 sets out the arithmetic). Despite all the growth in low-carbon electricity output China has also grown its coal output by over 1 billion tonnes a year in the past decade.

| Figure 1: China raw coal output, monthly, seasonally adjusted and annualised |
Take the changes since 2016, counting electricity only and leaving oil aside. On the cumulative stock China has still done more harm than good. On the annual flow it crossed over in 2025, and the stock should cross by about 2030.
The comparison is simple and the 2016 starting point is arbitrary, but I wanted a sense of the magnitudes for my own benefit. The charts set the CO2 avoided by the wind and solar China builds against the emissions from the extra coal, counting only the roughly 1 bt a year above the 2016 run rate.

| Figure 2: Annual rates: CO2 avoided by the wind and solar China builds against the emissions from its extra coal |
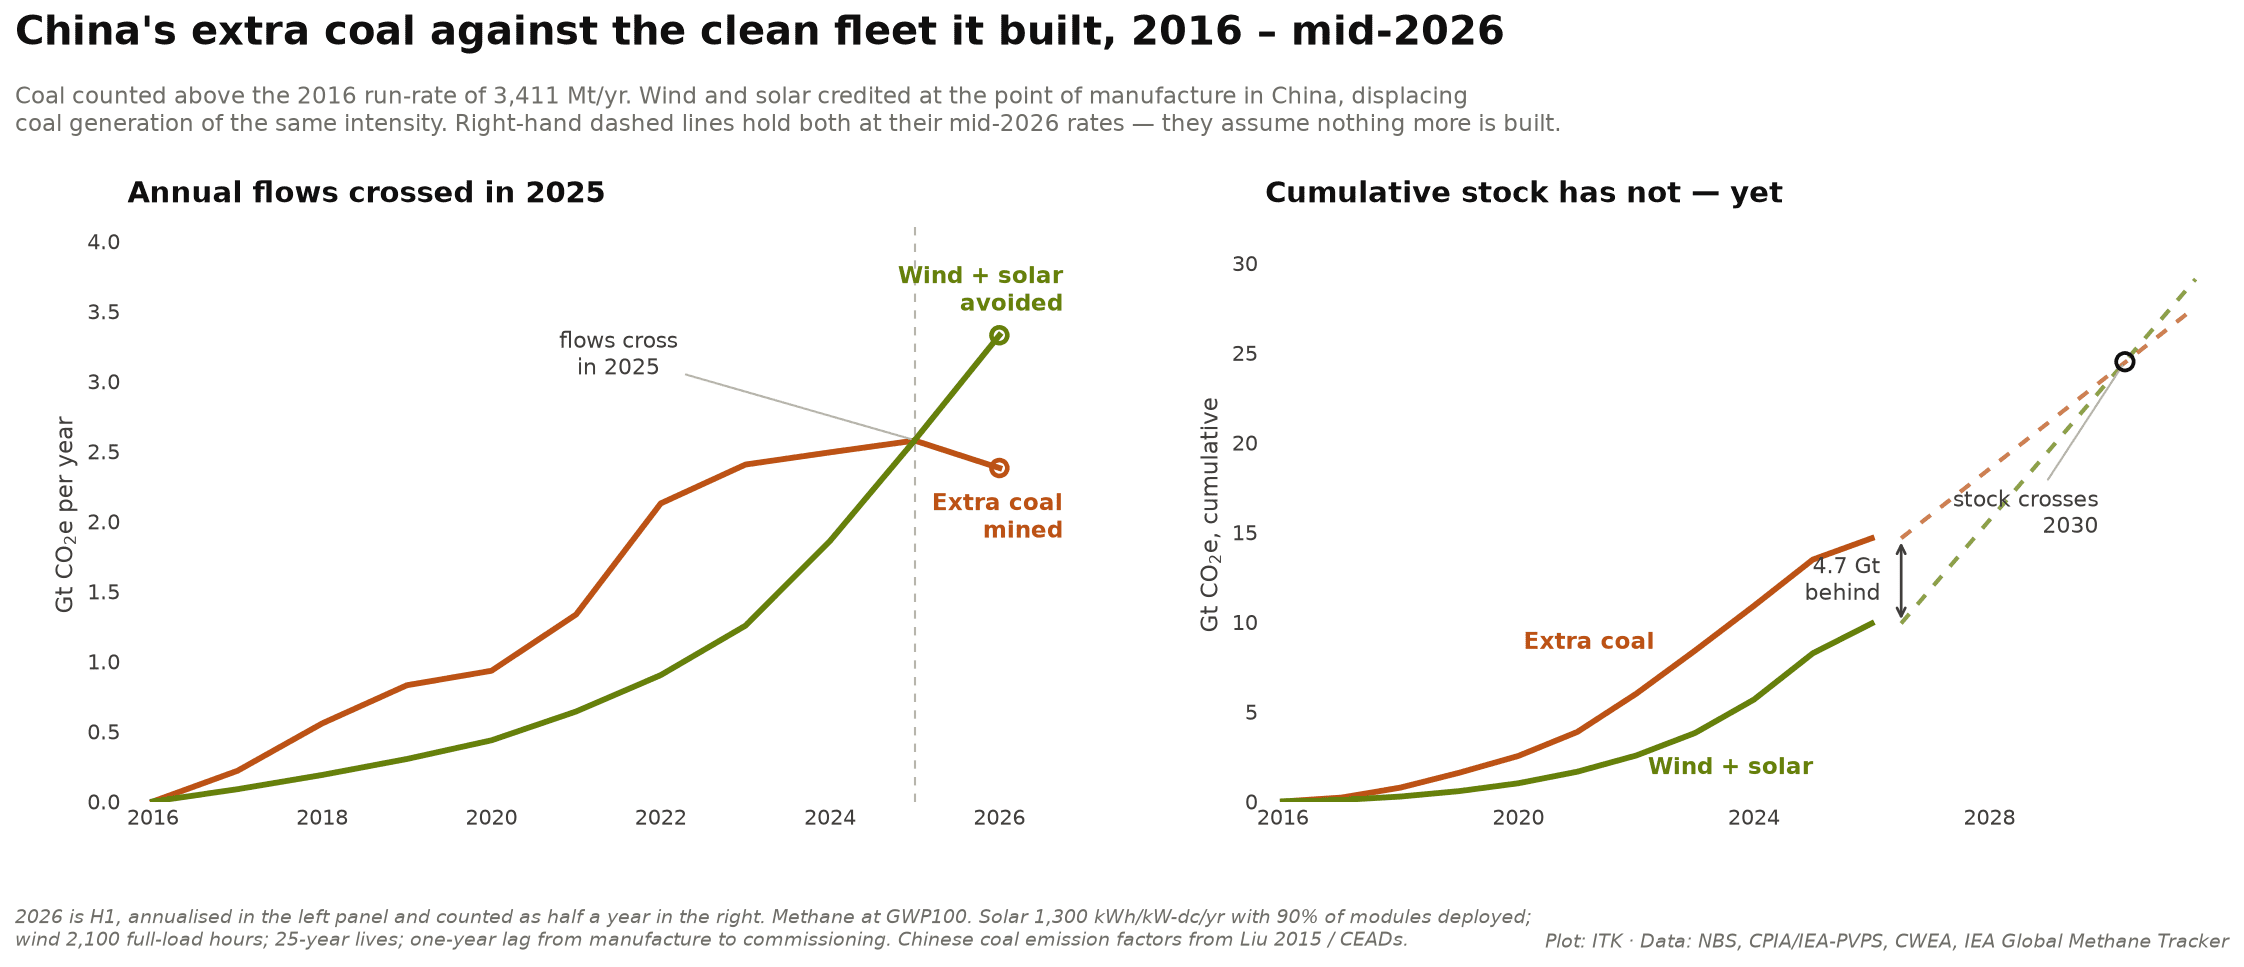
| Figure 3: China’s extra coal against the clean fleet it built: annual flows crossed in 2025, the cumulative stock crosses about 2030 |
Industry economics — delivered costs are rising
My view is:
- – Low delivered cost coal reserves are depleted
- – Realistic reserve life in the core producing region, 54% of national output, is about 25 years
- – Newer mines are either in the far west with big transport costs (Xinjiang) or further north in deeper low quality seams
- – Energy content of coal is gradually falling and the ash content is rising
Despite all of those factors heavy investment will probably see industry capacity continue to rise for the next few years as current investment comes on line.
As such the coal price is as likely to fall as rise and returns to coal mining companies will fall. Does this even matter in China?
Consumption outlook — the industry view
To be clear the scale of China’s coal industry is, as with many things China, enormous. The 4.8 bt per year is about ten times the size of Australian production and requires enormous reserves. A forecast of China’s coal consumption from the industry’s own central planners is:

| Figure 4: Industry forecast of China coal consumption by end use to 2060 |
Normally I discount the above kind of forecasting as a self-serving industry view. But I think for the next few years it’s consistent with what seems to be actually happening.
Set that against the forecast of output from existing mines. If the consumption forecast is right, depletion opens a gap of about 0.7 to 1 bt a year that has to come from capacity not yet built as of 2023. I suspect the decline will be steeper than this industry-sponsored forecast allows, but a lot of work went into it and who am I to disagree.

| Figure 5: Forecast output from mines already producing or under construction |
Where the coal goes has shifted. “Other” — which I take to include residential heating — has halved, from 21% of consumption in 2005 to 10% in 2022, while power generation has risen from 45% to 56%. Fortunately China has only half-heartedly proceeded with coal-to-gas and coal-to-chemicals.

| Figure 6: Where China burns its coal, share of national consumption by sector |
Where the coal is, and how it is mined
China is rich in coal and the following map may assist.

| Figure 7: China’s coal: where it is dug, and where it is held |
New mines face the usual constraints: (1) deeper and thinner seams; (2) reserves sterilised by what sits on top of them — water bodies, grasslands, buildings, railways; and (3) regulations that rule out, for example, mines more than 1,000 metres deep. In Hebei and Henan more than half the province’s resource cannot be mined normally on that count.

| Figure 8: China’s coal reserves: where they are, and what is already off limits |
As a result new mines in the Ordos basin (Inner Mongolia/Shaanxi) are becoming more capex intensive. Reserves are always a moveable feast but on the numbers Inner Mongolia has about 25 years left at current output, and at Shendong 84% of working faces are in seams of 3.5 to 8 metres while 55% of what remains sits under 3.5 metres.

| Figure 9: Reserve life by province, and the seams left at Shendong |
China has gone from almost entirely underground mining to about 23% open cut, and that share is expected to max out around 30%. But coal provinces get mined out. Even Inner Mongolia reaches its limits, and much of the new mining is in Xinjiang — areas I recently toured (Turpan, Dunhuang, Ürümqi) for what I expected would be cultural reasons. I thought I saw a lot of overburden.
Mines have become far more efficient, as you would expect, moving down their own cost curve. Even as at 2023 there were hundreds of autonomous trucks running, and within a few years electric autonomous trucks will be more significant in the open cut segment. One recent announced order was for 800 automous electric trucks. A single order.
The Government has tried to encourage ownership concentration and concentration has roughly tripled it since 2000, but the top four are still only about a third of output. Average mine size is far larger than it was.
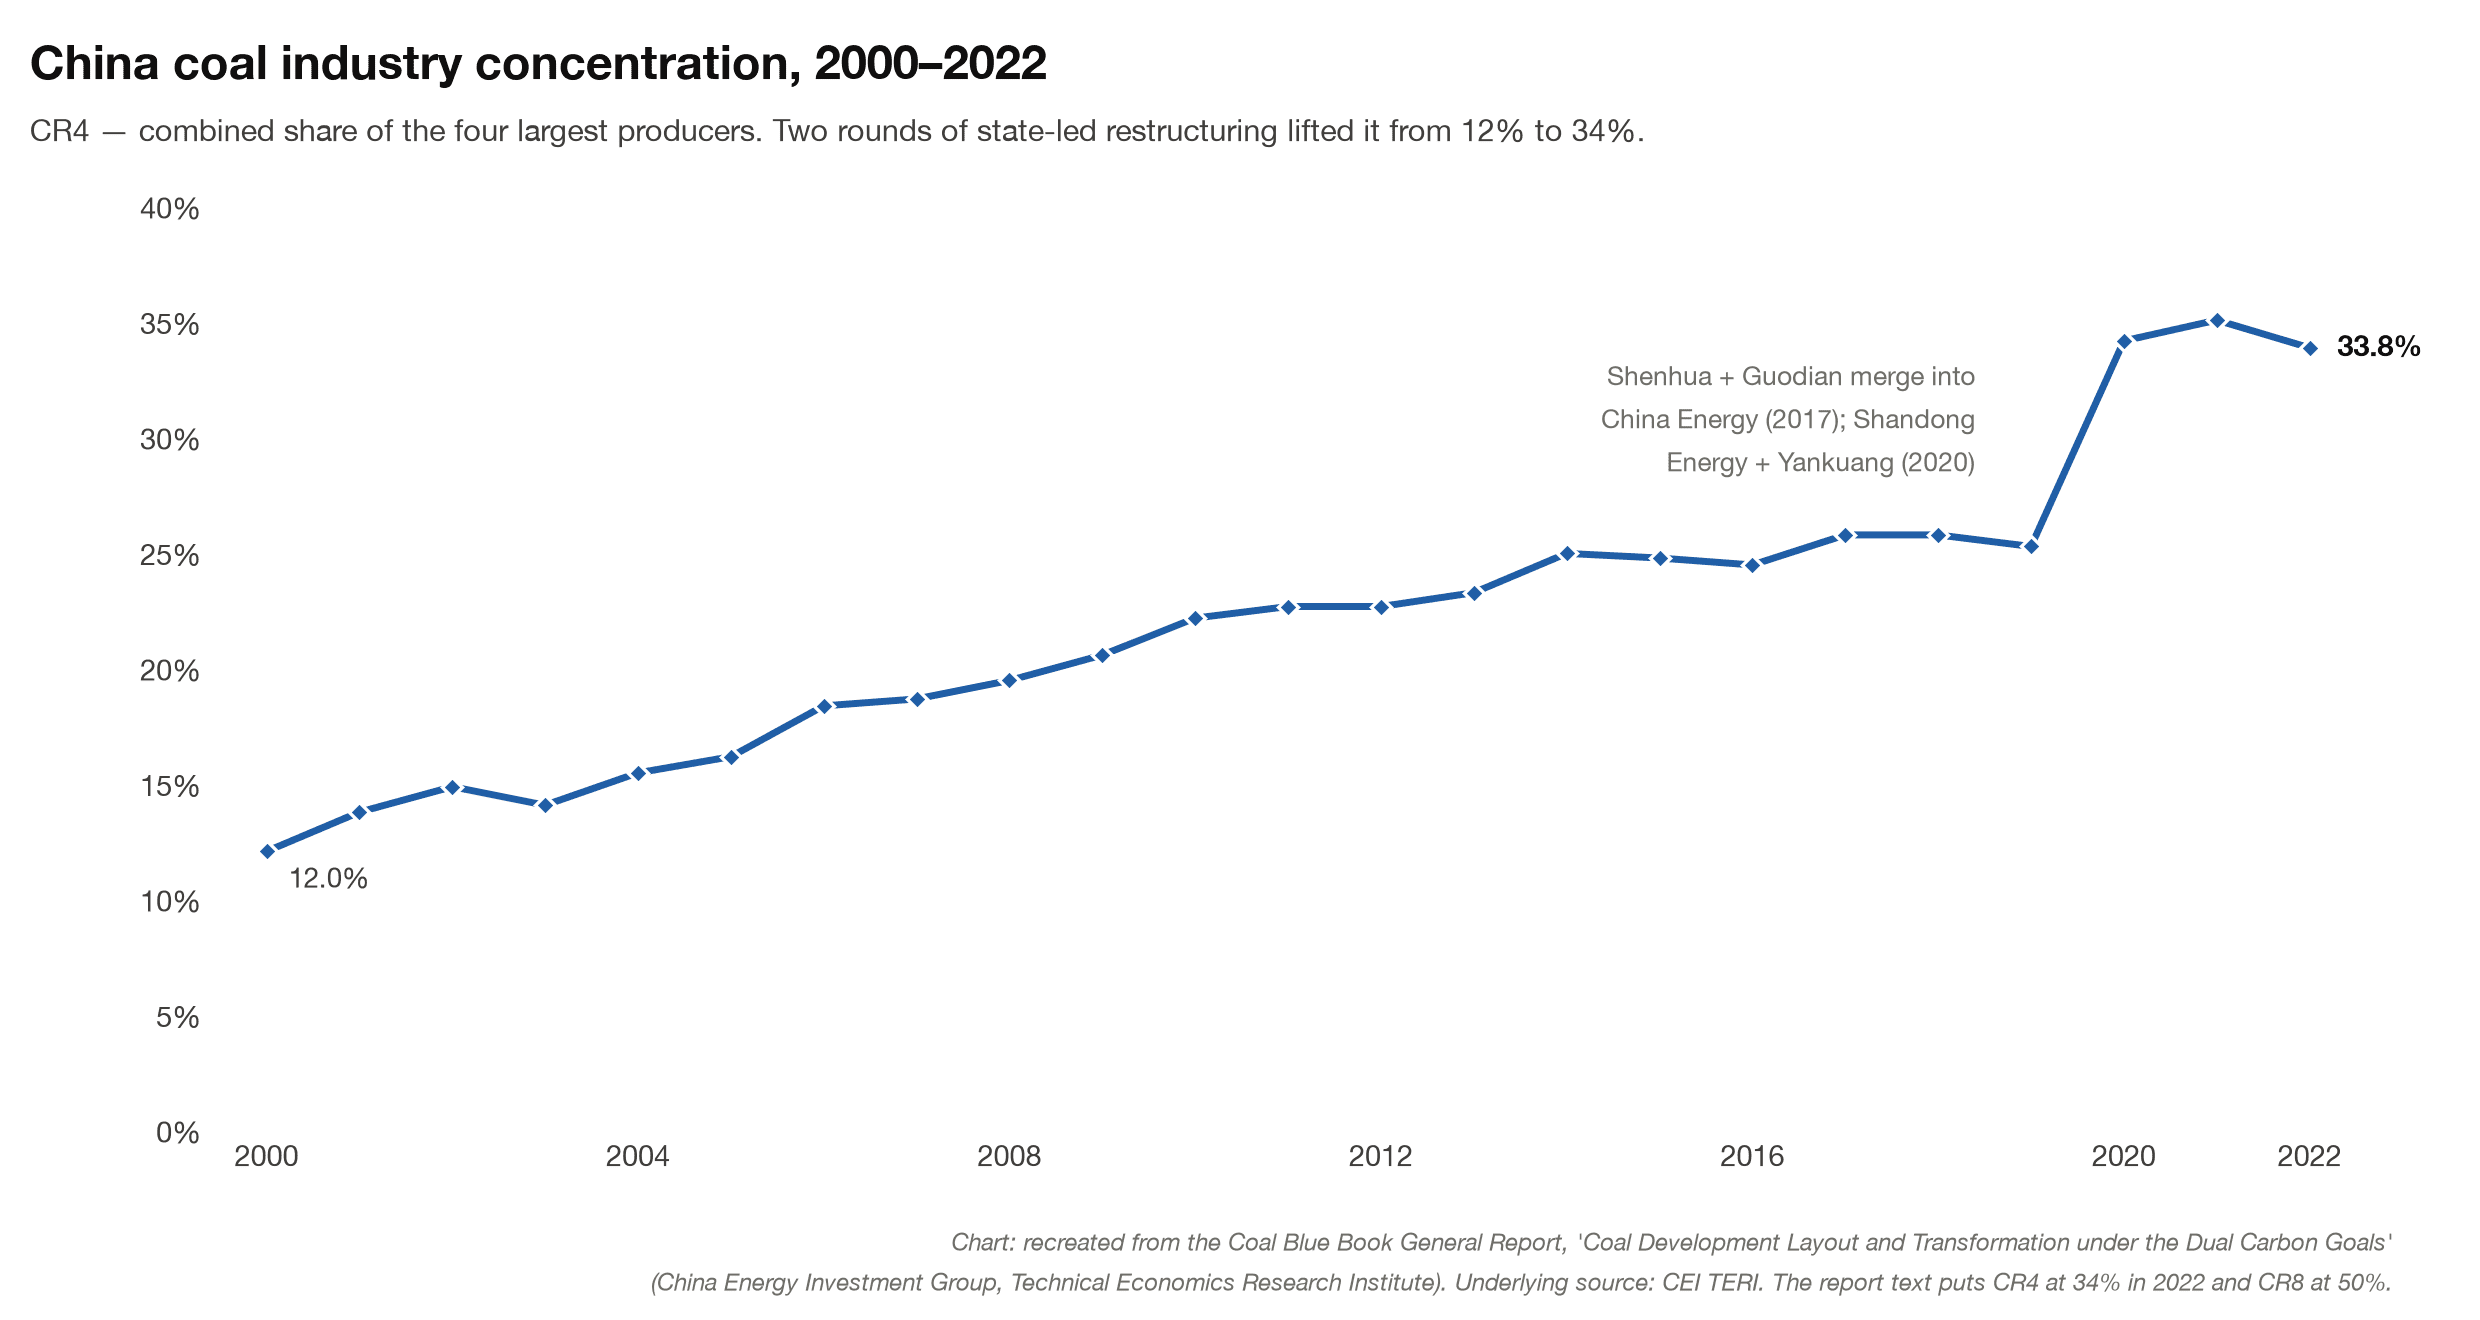
| Figure 10: China coal industry concentration, combined share of the four largest producers |
Xinjiang has one advantage. The coal seams are very thick — the main seam at the Zhundong open cut is around 70 metres, and other leases there work 45 metres or so across several seams, against 1 to 6 metres at a typical Bowen Basin operation.
That doesn’t mean less dirt is moved per tonne; Chinese open cuts shift about 5 cubic metres of overburden per tonne, much the same as Queensland. What it means is that the pit, the fleet and the workforce spread across far more coal for every metre the pit advances, and that is where the cost advantage comes from.
The outlook for China’s coal price and production
Using Shenhua as the guide, the price realised on its own mined coal has gone from RMB 548/t in 2023 to RMB 472/t in 2025, a fall of 14%, and profitability held up — Shenhua still earned 14.0% on capital employed. Shenhua’s cash cost at the mine is RMB 167/t and the capital in its existing mines was spent years ago.
New mines are a different number. A very rough build up of the price required at the mine mouth for new production is:

| Figure 11: Mine-gate price required to recover cash cost, capital and resource acquisition on four disclosed new-build projects |
Research found four new mines with enough numbers to guess at a price:
What a new Chinese coal mine needs at the mine gate
| Mine type | Example | Capex, RMB per annual tonne | Price required, A$/t |
| Shallow Ordos basin, 20 Mt/yr | Dahaize | 853 | 59 – 77 |
| Deep Ordos, vertical shaft, 16 Mt/yr | Xinjie 1+2 | 1,657 | 73 – 95 |
| Xinjiang underground, 2.4 Mt/yr | Weizigou | 1,660 | 73 – 95 |
| Deep Shanxi, 4 Mt/yr | Libi | 2,374 | 86 – 111 |
Source: capex from company filings. Required price is an ITK build-up of cash cost, capital charge at 6–8% real over 30 years, resource acquisition and tax. Converted at RMB 4.9 = A$1.
Despite the much higher capex, the extra rail and infrastructure, and the depth and environmental restrictions, China can still develop new coal for under A$100/t.
The company returns line up with that. Shaanxi Coal earned 17.6% on capital in 2025 and Shenhua 14.0%, both shallow Ordos basin producers; companies whose deep mines earn 1–2%.
Cost is not the only thing that changes. Deep and remote geology means smaller annual tonnes per mine, so as China moves down the ladder it gives up scale at the same time as it gives up the easy coal. There are also reports of capex overruns at new mines, just as in the West.
Shanxi, Shaanxi, western Inner Mongolia and Ningxia between them are 54% of national output and have about 25 years of life. Ordos city alone is expected to lose more than 100 Mt of output within ten years.
Shenhua’s construction in progress went from RMB 20.5 bn in 2023 to 33.3 bn in 2025, and China Coal’s from 11.2 bn to 26.3 bn. That shows up as higher depreciation as the mines come on line.
The coal is also getting worse. National energy content per tonne is down 13% over 20 years, and at Shenhua the ash content has gone from 14% in 2017 to 19% in 2025. The two regions that still have real reserve life — eastern Inner Mongolia and northern Xinjiang — are both low-rank coal.
At 330 Mt a year Shenhua is about 75% of what Australia produces, and you can see how low quality the coal is — under 20 GJ/t, down 6% since 2017.
Group capex has grown far more in absolute terms than mine development capex, up 4.1 RMB/GJ against 0.9, so most of the increase is in power generation, railways and ports rather than in the mines themselves.
We can’t use static capex as an ongoing number, so we can’t directly compute what price Shenhua needs at today’s costs. But cost per GJ rises faster than cost per tonne.
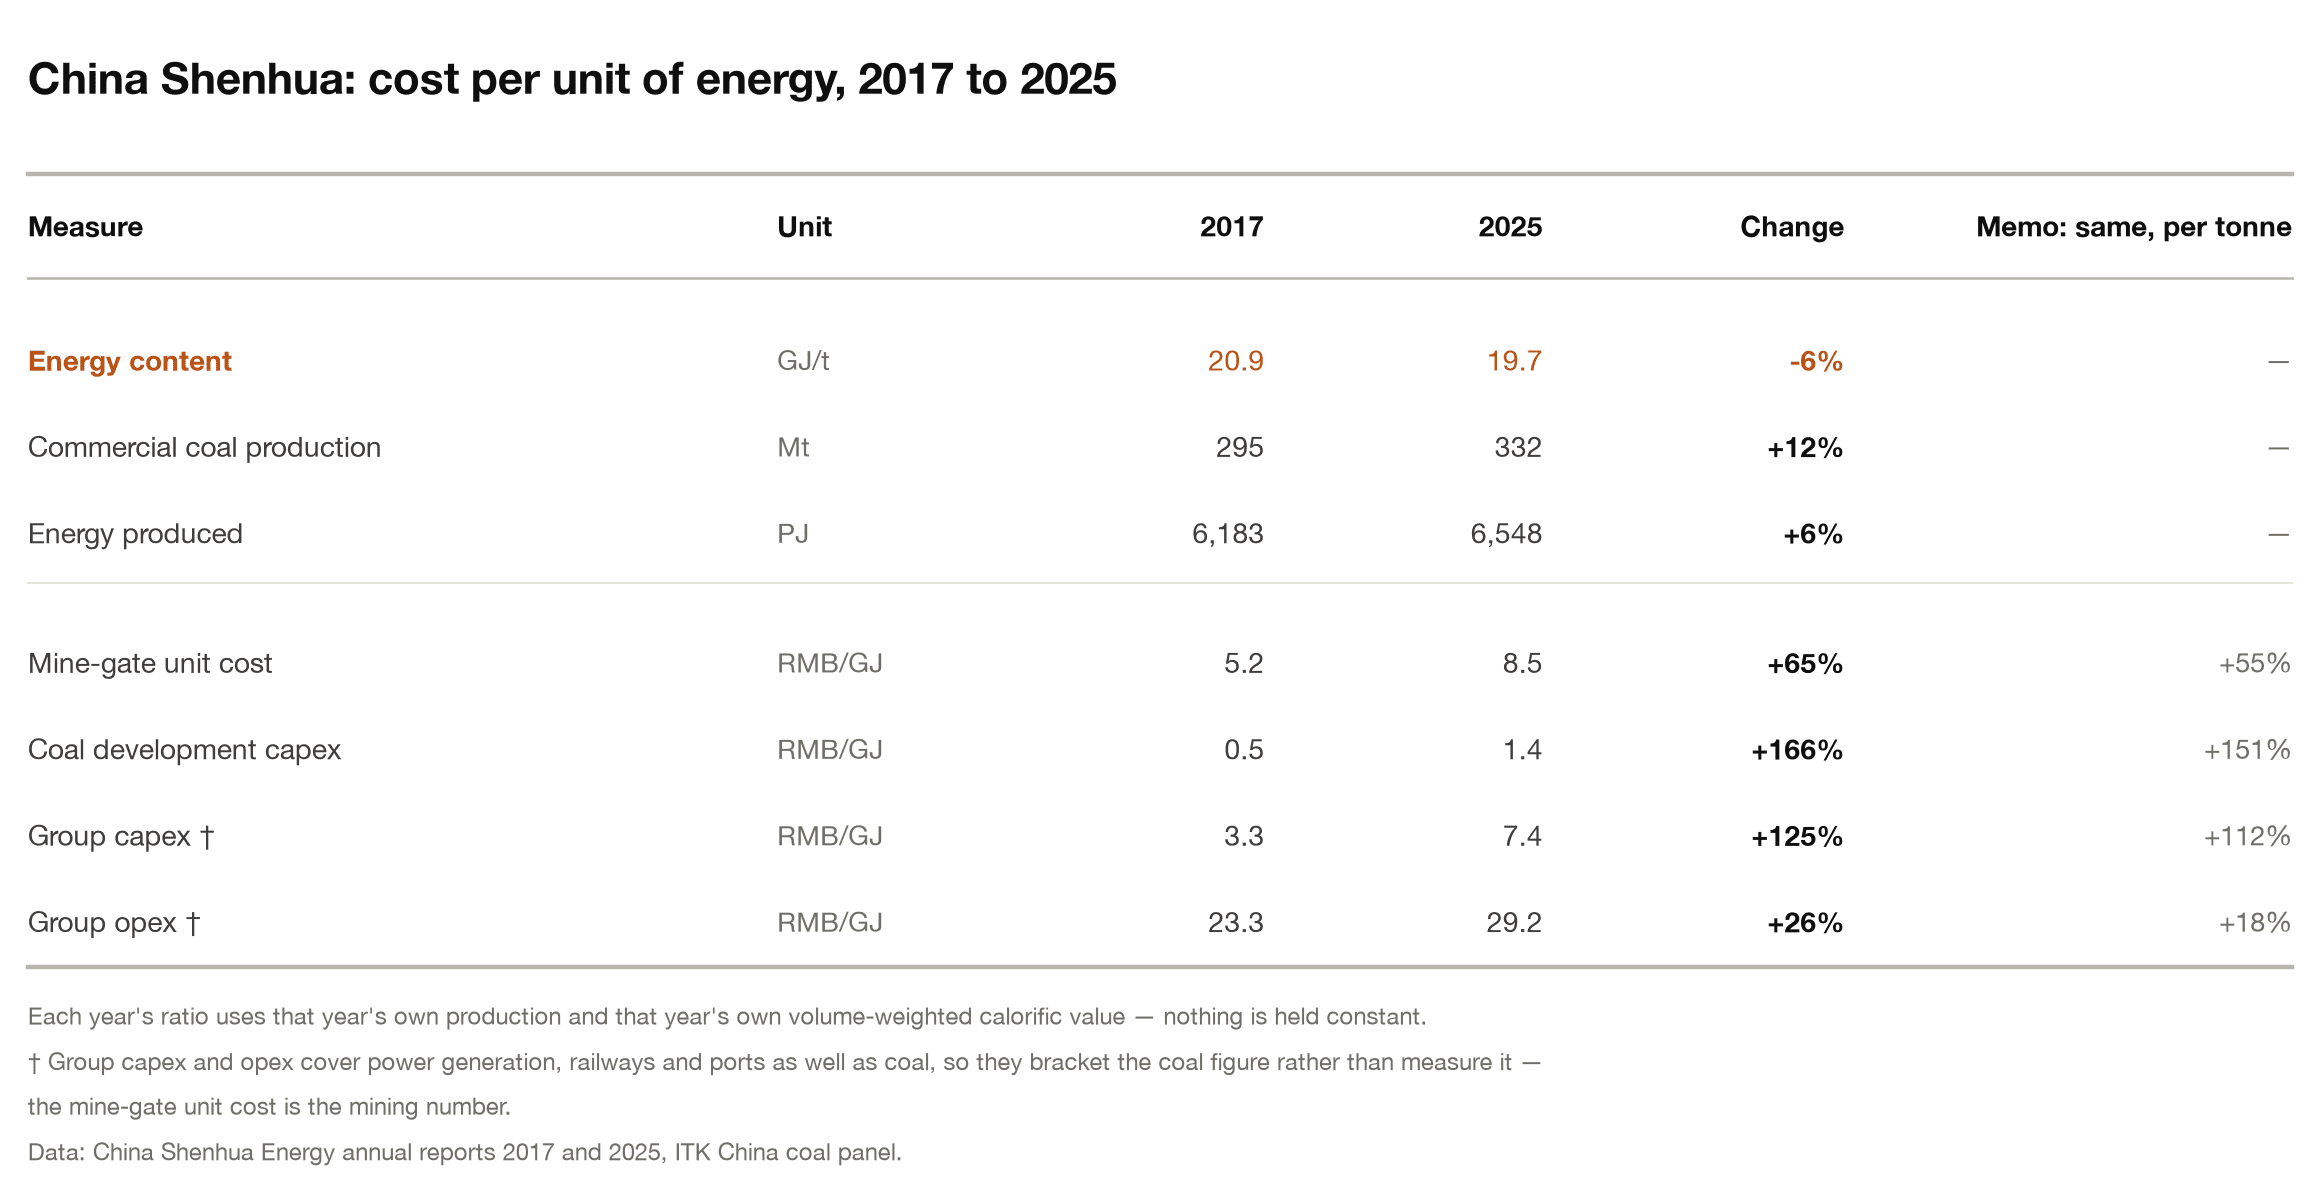
| Figure 12: China Shenhua: cost per unit of energy, 2017 to 2025 |
Getting the coal to where it burns
But mine-gate cost only matters if the coal is burnt nearby. China has largely dealt with Xinjiang by putting the generation next to the mine, and then building the transmission to shift the power to the East Coast. That coal generation competes with the wind and solar, which can only be built there, for transmission access It also means the Xinjiang open cuts get used as swing capacity, running below full output on high fixed capital, which raises the cost per GJ of the tonnes they do produce. One way or another it is expensive to move the energy production to the remote West.
The following map gives some indication of the expectation of regional supply and demand and therefore the need to consider transport costs.

| Figure 13: China’s coal: where it is dug, and where it is burnt |
China’s power generation build appears to have kept pace with the shift in production, so the tonnage that has to travel is hundreds of millions rather than billions. On 2025 numbers only about 200 Mt from Xinjiang has to make the expensive journey east.
Shanxi and Inner Mongolia are the exception, and the bigger number. That region digs 3.45 bt and burns 1.52 bt, so about 1.9 bt a year still has to move east, and when it gets there it competes with imports.
The Daqin line alone, at 653 km, adds about RMB 81/t — A$17 — and it is the shortest of the major hauls. Energy-intensive business in Shandong and the Southeast is likely to see increasing delivered energy costs.
China is spending in the next five-year plans about US$0.5 trillion on overall transmission and within that will build an additional 100 GW of UHV transmission. That cost is partly for the increased coal generation. As a consumer it still has to be factored in.
Returns are falling
Data can be cut lots of different ways and sometimes it’s very hard to “read the straws in the wind” (my new combined metaphor) After all the work though my view remains that the remaining reserves will end up more expensive to extract.
This may lead to lower returns on capital, or to higher coal prices. The share market at the moment seems to be pricing in good news that is just not evident in the data.
The table below shows the coal price — here the price across all coal Shenhua sells, including traded tonnes, so a higher number than the mine-gate series above — has barely changed in nominal terms, although about half its coal is sold at an administered price.

| Figure 14: China Shenhua: realised coal price and return on capital employed, 2010 to 2025 |
Another approach looks at the spot price of coal and share prices.

| Figure 15: China’s coal shares against the spot coal price, levels and rates of change |
Given where the coal price and the returns have gone, the share price index is hard to explain.
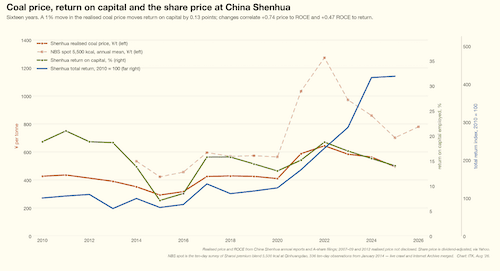
| Figure 16: Coal price, return on capital and the share price at China Shenhua |
Appendix — China coal share of global emissions to 2040 at current production
The arithmetic behind the 14% share, and what it means for temperature, is below.

| Figure 17: China’s coal: share of global emissions and added warming to 2040 |
References
- Research Group, Technical Economics Research Institute, China Energy Investment Group, “Coal Development Layout and Transformation under the ‘Dual Carbon’ Goals”, General Report, Coal Blue Book (煤炭蓝皮书), 2023 edition. Behind Figure 4, Figure 5, Figure 6 and Figure 10, and the reserve and demand-region data in Figure 7 and Figure 13. Print only. The same volume’s chapters on open-pit mining (Jiang Lin) and Xinjiang outbound transport (Zhu Meng) sit behind the open cut share and the transport section.
- Wang Tong et al., “Coal resource security capacity and exploration direction under the dual carbon goals”, Coal Science and Technology 51(12), 2023. Behind the regional reserve life in Figure 8 and the 25-year figure used throughout.
- Gao Sheng, Zuo Qianming and Li Rui, “Coal 2025 mid-year strategy: the outlook for output decline in central and eastern China”, Cinda Securities, 2025. Behind the sterilised-reserve shares in Figure 8 and the Shendong seam split in Figure 9.