This overly long note seeks to make the following points.
- Networks are the most valuable part of the electricity value chain and are increasingly important as behind the meter grows but are largely ignored in the reform process.
- For solar and batteries technology system costs are likely to be lower, the closer consumption is to production.
- Community battery installation costs are absurdly high. According to KPMG, a 250kW battery has an installed cost of $2000kWh and the total installation cost would be $900kWh compared to say less than $100 kWh for a Tesla Powerwall.
- Networks have been forced or chose to set more of their tariffs based on consumer maximum demand as opposed to energy consumed or fixed cost. Despite theoretical deficiency this might be more equitable as between solar and non solar residences, but because it’s too hard and retailers don’t charge that way, is irrelevant in practice.
- In an entirely and no doubt unrealistic fashion, I speculate that household and system costs might be lower if networks were allowed to own retailers serving their own franchise. Alternatively, notwithstanding the potential for abuse, embedded networks if they were community owned, as in part of the strata or similar costs, could also be an effective model.
Networks are the largest part of the electricity value chain
Australia’s last-mile distribution system is worth around $A120 billion at market values (equity + debt and based on EV:RAB (enterprise value to regulated asset base) ratio of 1.5). By contrast, Australia’s largest gen-tailer AGL has a market cap around $4 billion + some debt and Origin Energy’s market cap is $8 billion.
Even if EnergyAustralia was separately listed (it’s part of the HK-listed CLP), I very much doubt if the combined market cap of the three of them would be much above $20 billion, and that’s 40% of the generation and 70% of the retail market.
So wires and poles are massively valuable, but ever since J. Frydenberg limited their ability to appeal regulatory decisions they’ve disappeared off the radar. We haven’t heard much about “gold plating.” In fact we haven’t heard much.
What you can see is that Spark Infrastructure, which owns 49% of Powercor, Citipower and SA Power Networks, is being taken over, and that AustralianSuper is selling 16% of Ausgrid.
Notwithstanding structural subordination, Spark is being sold on 1.5X EV:RAB, which seems on the low side to this analyst but equally seems acceptable to everyone else, so what do I know.
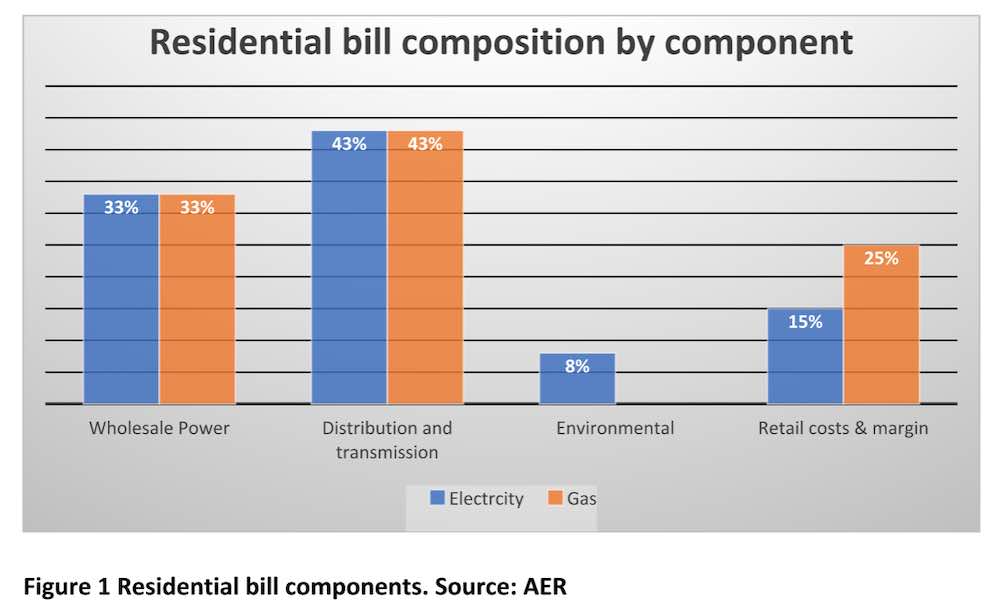
Let’s start with the bill composition. This is the only time I’ll refer to gas.
I prepared this chart to show that distribution and transmission is about 43% of the average residential bill but what jumped out at me was that gas consumers do not pay any environmental cost and, effectively, the equivalent of the actual environmental cost for electricity consumers shows up as extra profit for gas retailers.
Behind the meter network role is largely ignored by system designers
When the Australian electricity system was deregulated, the role of serving the customer was divided in two. One part was selling electricity to the customer and the other part was supplying it.
The theory was that the benefits of competition would outweigh the extra costs involved. Perhaps that was once true, but I don’t think it is anymore.
Networks that could be managing electricity consumption to ensure it takes place as close to the point of production as possible, thereby minimising connection investment, have no incentive to do so.
Networks are incentivised to maximise their regulatory revenue cap and, to a lesser extent, minimise their actual costs.
Minimising costs confers no lasting advantage as, in theory, it’s eventually regulated out after a “benefit sharing” period.
Any advantage gained from innovation is effectively regulated away to the benefit of someone other than the network owner.
Networks are seeing flat energy, but a steadily increasing number of connections and slowly increasing maximum demand. Networks have plenty of spare capacity. For networks, behind the meter is a problem; it reduces energy through put, doesn’t necessarily reduce maximum demand, and may lead to some extra costs.
Households with solar, and especially those with solar and batteries, don’t pay their full share of network costs. They use the wires and poles less. A zonal substation can support far more connections in a heavy solar area, particularly if there is a bit of behind-the-substation storage.
But the way customer tariffs are set up shifts some of the costs onto households without solar (and now batteries). This creates an incentive for all those houses without solar to also “join the herd”.
Meanwhile, the ability of the residential sector to become largely “self sufficient” and the impact that might have on system costs is not properly modelled. A general principle of the ISP, and what seems like obvious common sense, is that the closer electricity consumption is to production, the lower the overall cost will be.
If central generation is cheap enough due to economies of scale, as happened with big coal generator development in the 1950s and 1960s, the transport costs can be overcome, but now that’s much less the case.
Regulation is basically the enemy of innovation, or, put another way, the profit motive is the friend of innovation. The AEMC required networks to have a marginal cost so they invented one – demand charges – even though there is plenty of network capacity.
This got the AEMC off their back, but as we show below, demand charges have no real-world implications at present. Networks charge households for demand but the households don’t know this because the retailers don’t price that way.
If retailers did charge a demand tariff, it would partly restore the inequity of non-solar houses having to pay a greater share of network costs than solar houses. Houses with solar still tend to see the same max demand as houses without. But demand charges encourage households to install batteries.
Even a very small battery, in terms of energy, might make a big difference in terms of the maximum demand charge. Retailers don’t want houses to put batteries in. Their economics would get even worse.
Networks sort of don’t care, because they just jack up prices because they get a revenue cap more or less the equivalent of a fixed annual capacity payment.
The functional split is not just a killer of innovation but results in extra system costs. In theory, networks should know more about local demand than anyone, but the AEMC, in one of its all-time brain farts, decided that it should be up to households to see if they valued a communicating meter.
Households, on average, haven’t got a clue about electricity; didn’t realise or understand either the benefit to them or the societal benefit, and let it slide. And so outside of Victoria, the system relies partly on houses with solar to tell them what’s going on.
That is for a majority of properties outside Victoria, neither the retailer nor the network, nor AEMO nor the homeowner, knows how much power is being consumed at any point in time in the average house.
Compare that to the phone, or the internet. Yet at the generation level, price settlement is moving to a 5 minute basis.
In addition, the separation of residential sales from networks resulted in high IT costs around system duplication, overheads, and potential barriers to information access.
We think zone substation capacity can be minimised the more self-sufficient houses, streets and suburbs are. Maximising consumption of DER where it is produced would also tend to increase opportunities for utility solar.
A proper residential storage plan, which might focus on community batteries, or if they are too expensive, local coordination of household batteries, could significantly reduce the need for firming power and its associated transmission investment and energy losses.
The ISP “step change” scenario forecasts some behind-the-meter storage, but doesn’t test for its relative benefit.
What I learned myself from this note, though, is that network tariffs won’t achieve much of anything unless they change retailer pricing plans.
Alternative models
One model, as in California, is a Community Choice Aggregator, which puts the local Council in as the electricity buyer. That’s an alternative to the wires and poles company which is also the retailer in the wires and poles franchise.
Obviously it’s not the model Australia adopted. Without discussing it further here, I find it hard to see how such a model solves any of the issues discussed above.
Another model, which has been adopted for some purposes in Australia, is embedded networks. In this concept a housing estate or an apartment block can have a central meter and electricity supply and retailing and cabling is run by management of the embedded network.
Under Australian law, as I don’t really understand it, residents or customers can’t be forced to join the embedded network. The concept is fine but runs the risk that whoever owns the embedded network can rent seek.
The Estate developer may auction off the embedded network rights to the highest bidder who then recovers the cost and more from residents. Such a model, though, could be its own microgrid, and has the potential to be low cost.
One way around rent seeking might be to make the consumers of the embedded network the owners, with the capital cost embedded in the cost of the premises, as with Strata titles, and then put the management rights out to tenure for a fixed term.
Community title is another alternative. Strata title is a workable model, not always a happy one, but over 2 million properties are owned and managed that way.
Maybe an efficient way of supplying residential electricity to areas with high solar penetration is if the network and the retailer are the same organisation.
Only one call centre is required, only one IT centre is required, customers are encouraged to maximise self consumption, storage is installed to maximise consumption close to production and, in general, the network tries to be as self-sufficient as possible.
The network costs are capitalised so that rather than the owner getting paid each year for the invested capital, instead the residents buy the connection rights. The network then only charges for maintenance and higher-level common costs.
The load-serving entity still has to manage the power purchasing from outside the franchise, but because of the high self consumption that cost is minimised. Enough dreaming.
Network cost drivers, demand charges and retailers
In the past couple of years, despite lots of evidence saying it was ill-conceived (since individual household max demand is not coincident with system max demand), not cost reflective, and too complex, networks have moved from a consumption-based tariff to one that is split between consumption, maximum demand and fixed daily connection cost.
For instance, here is a calculation for an Ausgrid residential customer. I had to assume what the maximum demand for this consumer was, and the unit price is the average over the “high” and “low” season.
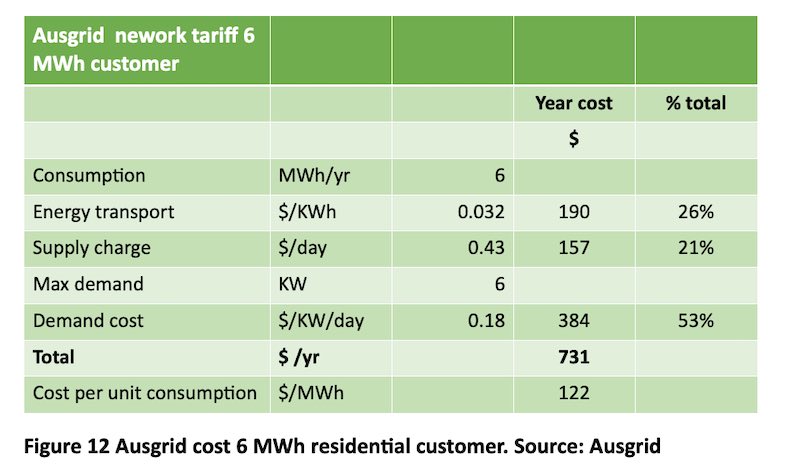
What behaviour does this encourage for households? Well, we don’t know because the major retailers don’t factor the demand cost into their tariffs.
For instance, the AGL “super saver” tariff for my suburb has a fixed cost of $0.82 per day + 21.6 c/kWh. Energy Australia’s simplest and seemingly lowest-cost plan is $0.726 per day + 24.2 c/kWh.
There is a time-of-use plan, but again it’s based on consumption, not power. Origin’s plans also appear to be energy and time-of-use based with a fixed cost component.
Not one of the retailer plans has a residential “demand” charge unless I am misreading the plans (always a possibility). Retailers just manage it as part of the overall network cost they pay.
Bottom line: Network demand pricing will have zero incentive on consumer behaviour as the consumer neither knows what their maximum demand is and nor do they pay for it. It may be that the retailers factor the demand cost in somewhere and it influences what they charge, but it ain’t obvious.
Network actual performance
Electricity 101 starts with explaining that Australia adopted the UK model for deregulation following the Hilmer reforms in the early to mid 90s.
Those reforms were designed to break up the state-based electricity empires, create the NEM – that is, link the states into one system – and specifically create market facing generation sector and retail sectors, and see wires and poles as regulated monopolies.
Only 25 years ago there was no retail sector and the concept of a retail customer did not exist. The retail sector was created artificially by market designers.
It was ideologically pure and seemed like a good idea and, early on, prices did fall. I supported the breakup but have come to reconsider.
Subsequently, following natural market tendencies, retailers and generators have linked up with each other (vertical integration) created market power and set out in the normal industry fashion of trying to minimise actual competition and organise the system in their favor (largely unsuccessfully).
But the process did succeed in breaking up the (network/customer) link that arguably was the more natural fit.
One way to look at the performance of the networked business is from annual regulatory statements. The AER collects the data for the purpose of bench marking and publishes a summary, which has data up to 2019, at present.
The following figure is extracted and you can see $78 billion of assets, 10 million points of presence (the AER calls them customers, but they are not customers).
As Bruce Mountain says, only half in jest, the AER is the customer of the networks, but in any event households are customers of the retailer (and I’ll return to that point) and 145 TWh of energy (or about 75% of the total supply in the NEM) goes through the distribution system.
RAB = Regulatory asset base, which is the No 1 number in everything to do with wires and poles.
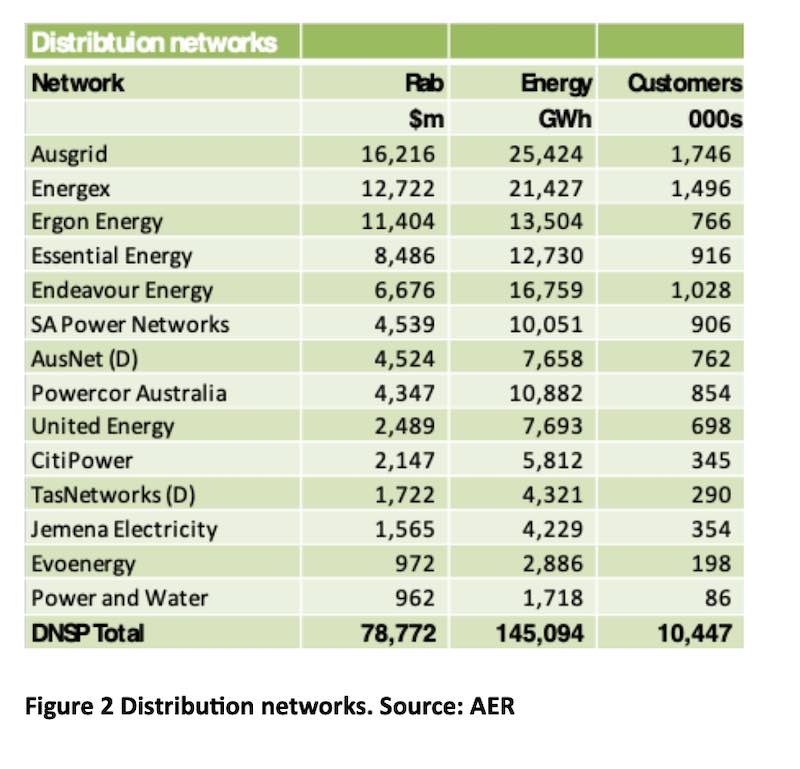
Also the Queensland and NSW networks dominate in terms of RAB and customer numbers. The Queensland government owns the networks and the NSW government owns half the NSW networks.
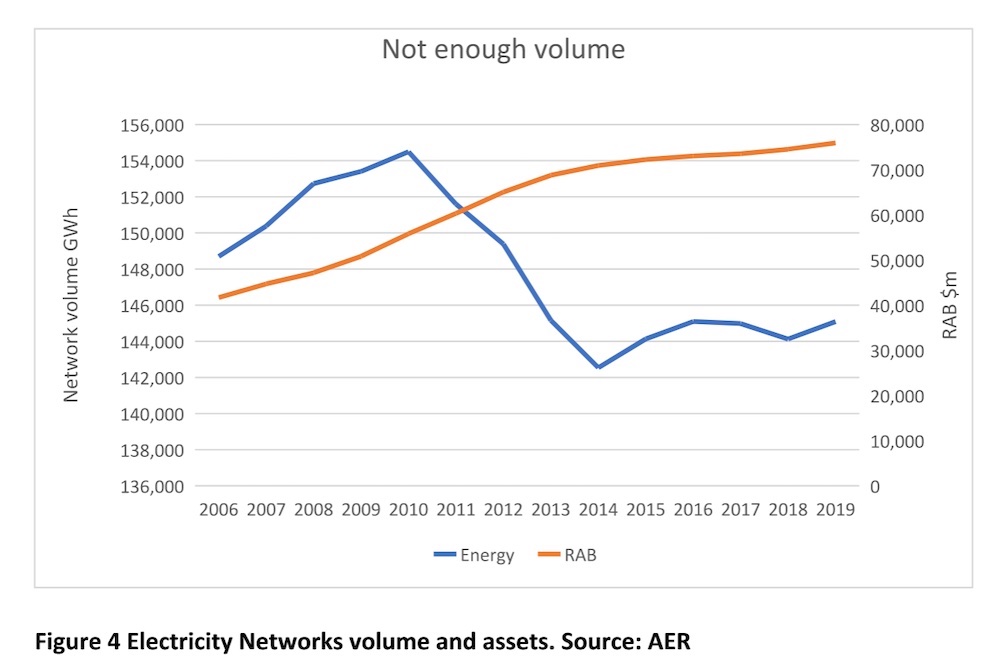
Now let’s look at the time series. My favourite chart for many years of analysing networks shows that the asset values are always going up but energy isn’t. Points of presence (abbreviated to customer hereon) are up 20% in 13 years.
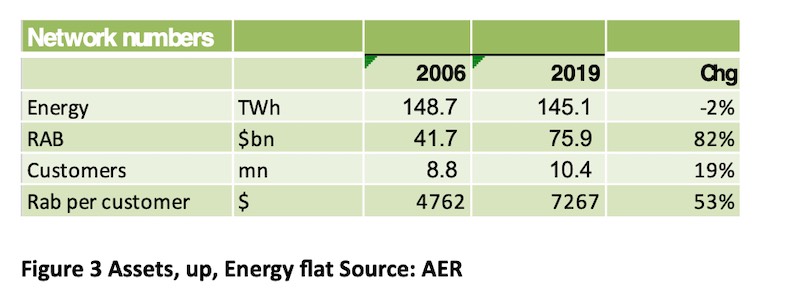
Volumes have rebased and started growing, although I suspect when we see the 2020 and 2021 numbers that may disappear.
I don’t plan to make a big thing of it, but the volume decline was partly a response to electricity prices and partly the focus by the government of the day on energy efficiency, insulating houses, all that sort of stuff that the current federal government doesn’t give a stuff about.
That increase in energy delivered came despite the ongoing rush to behind the meter.
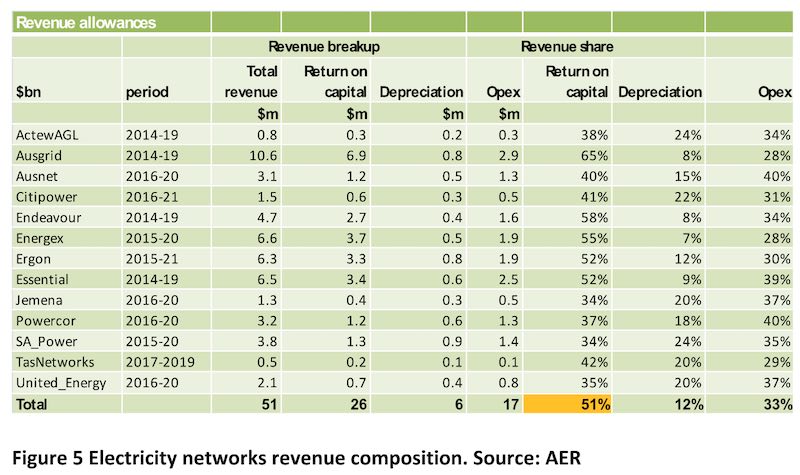
The key metric for electricity prices under the current system is $/RAB per customer. I had to dig even further back into the data for this summary but the basics will remain true.
Namely, about half the network revenue (recovered from “customers”) represents return on capital invested, so the more the capital grows the higher the revenue to be recovered from each customer.
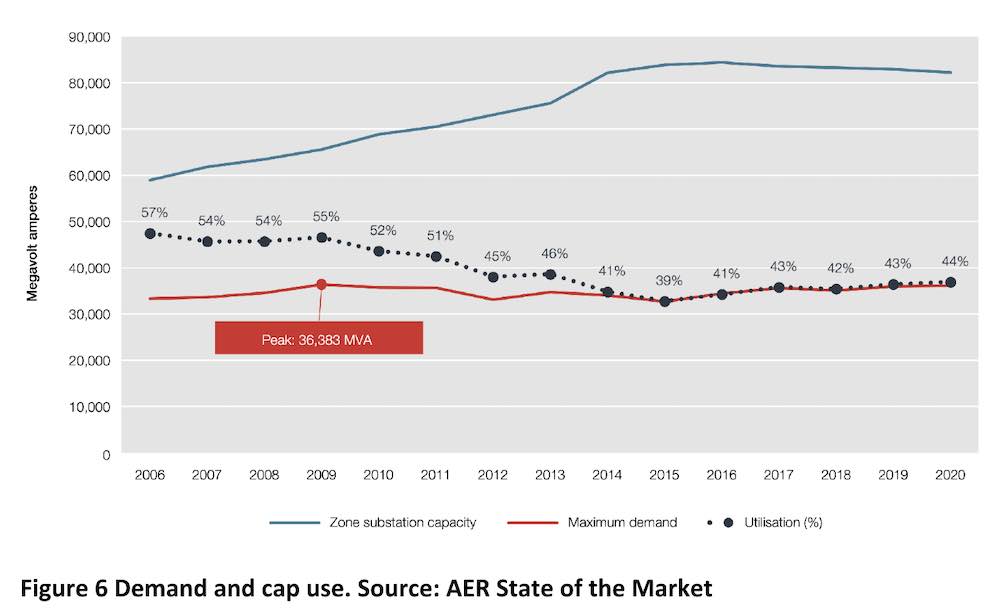
By and large, the fall in energy consumed in the 2010-2014 period caught the networks unprepared and they were in fact busy spending capex to cope with expected increases in demand… By and large, maximum demand has done better than total energy and maximum demand is a driver of required capacity.
Still, the bottom line is that capacity utilisation is low, other than for United Energy and Powercor.
Transmission is not the focus of this report, but is included in this capex breakup to illustrate that there hasn’t been any growth capex in transmission for 10 years. More broadly, growth capex in the entire sector has been minimal despite the 20% increase in the number of connected households.

Finally, in this sitrep we can look at the return on assets and profit per “customer.” It’s unexciting, to be sure, returns are well down, partly due to more control by the AER and partly due to lower interest rates.
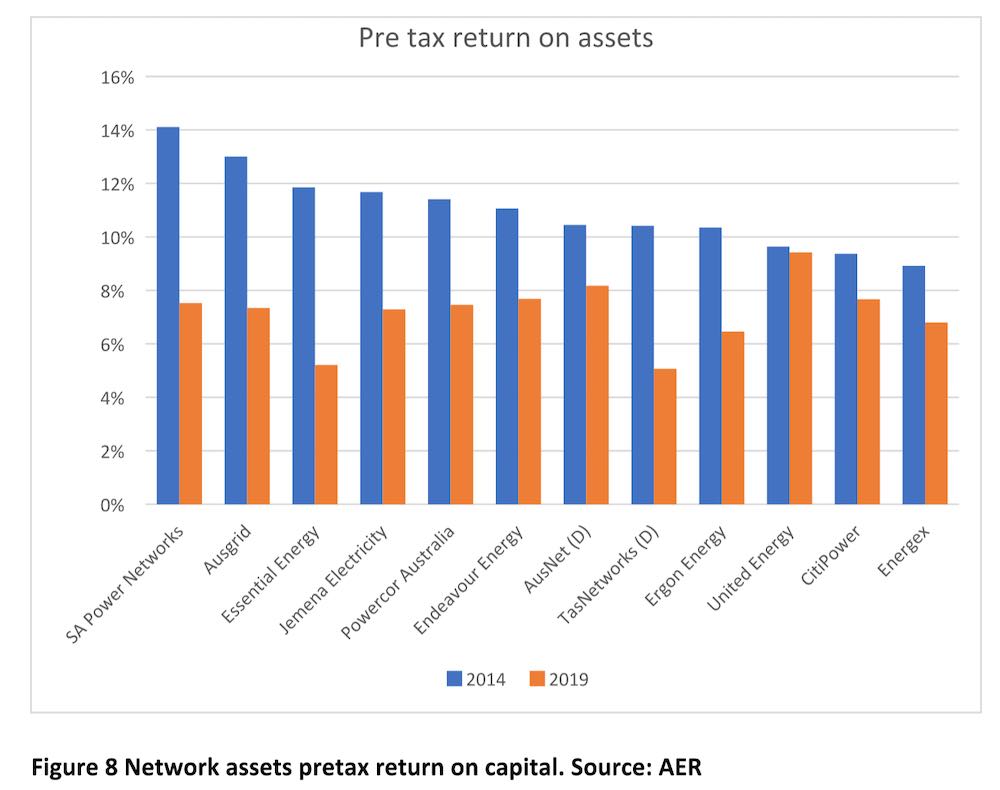
Although profit per customer is an outcome of the regulatory process, and not something management have any ability to target, it is interesting to look at:

Network cost drivers
The key initial point is that most network costs are driven by:
- Initial investment, which in turn is a function of connection spacing and, to an extent, the number of connections.
- Ongoing opex, which is largely a fixed cost
I’m indebted to Mervyn Davies, ex-Ausgrid, for the following graphs and explanation.
Mervyn gave one of my top 10 favourite presentations I’ve attended or read in the past five years to a tiny audience of about six people at an APVI seminar organised by Renate Egan that I accidentally turned up to at a time when tariff design was a hot issue. Anyway, thanks Mervyn and thanks Renate. I can only show a fraction of what Mervyn had to say in that one presentation.
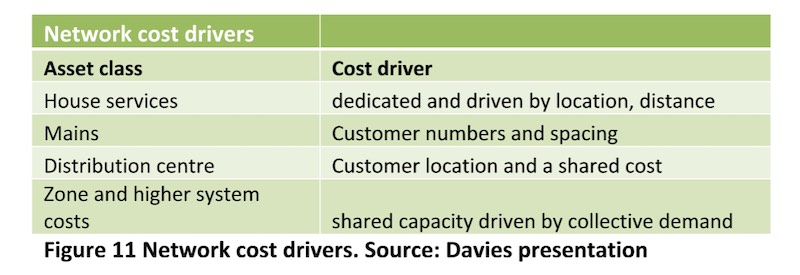
Starting with a diagram, the essential point is that the cost driver for most of the network is a combination of location and required capacity. Demand drives very little of cost and the vast majority of the capital investment is a fixed cost.
So, whereas there are literally 1000s of articles about generator locational marginal pricing there are close to zero articles about distribution locational pricing.
Whereas generator locational pricing discussion is fairly useless (in my opinion) to all but theoretical economists and some generators, distributional locational pricing should be a vital topic for customers, the ESB, the AEMC and the AER. But it is not.
If it wasn’t for the ANU leading the discussion of a Locational Use of System Tariff [LUOS] this vital topic would be deader than the dodo.

To paraphrase:
“In Urban networks Including sunk costs less than 50% of cost is driven by demand…
More than 50% of costs driven by customer location… In rural networks locational costs can be as high as 80%.
The spacing between customers drives most of our poles and wires cost both high and low voltage regardless of demand.
‘Mains’ give customers access, they cost the same regardless of required customer capacity and are a shared asset with amount required being dependent on density (ie premises spacing)
Logically the basis of sharing would be locational paid as a capital contribution at the time of connection and or perpetual annuity.”
In summary:
So even in the old/current system, location was a major driver of costs and the costs are essentially fixed at the time the network is built.
Community batteries cost more than household batteries
But even that was only a 2016 view. Since then, we have had the enormous and increasing growth of behind-the-meter assets, the new system-wide issue is minimum rather than maximum demand, and storage has emerged as a new asset class.
And also on the technology front we have the rise of inverter-based control, including the emerging “delta” variant of grid forming inverters.
ITK has been a fan of community batteries since Western Power first presented on them at a conference. It’s easy in Western Australia, where the government owns everything and things like network charges can be overcome.
Indeed, it’s that very ease of overcoming that difficulty that makes me think electricity might be better managed as discrete geographical units (retail + network + local generation) = a franchise (this is a widely used model in the USA) as opposed to retail and generation are national, market businesses and wires and poles are monopolies.
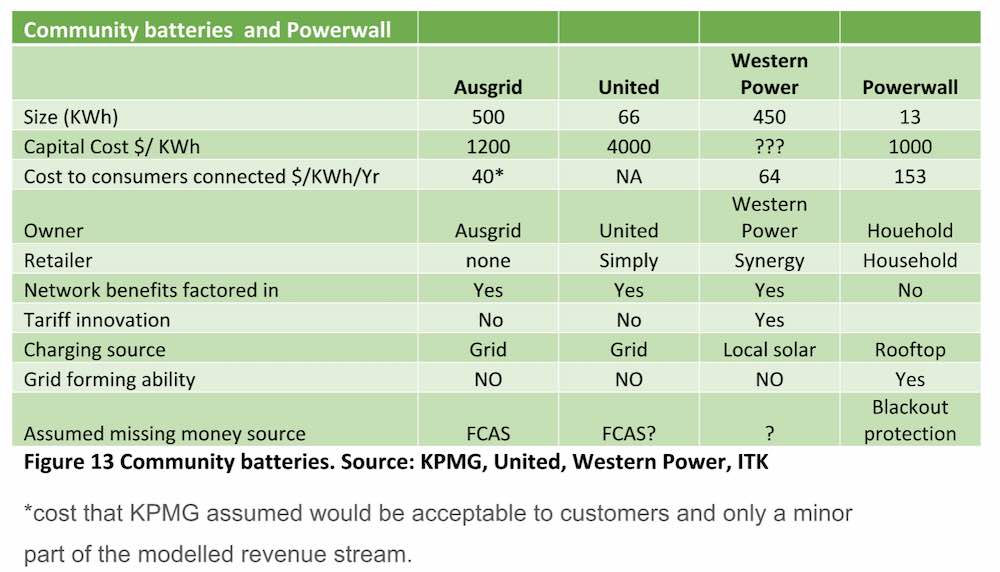
But at the moment, community batteries are looking like losers from a cost perspective. It seems like installation costs are nearly as high as the battery cost and that a 500kWh installed community battery costs more per kWh than a 13kWh Powerwall, on an installed basis.
ANU runs a battery storage and grid integration program
In Dec 2020, likely reflecting the state of the market in 2019 and early 2020, the ANU produced a report for an ARENA fund project:
“Community Models for Deploying and Operating DER project”
Rather than rewrite the ANU summary main points I copy and paste:

It’s the local use of system tariffs [LUOS] that really caught my eye.
In some ways a community battery is to battery installed in the house (or unit) as rooftop solar is to utility solar.
Essentially, if a battery is installed in the house, it benefits the household and if charged from rooftop solar means that little or no network charges are incurred.
If the electricity is used within the household, then the household’s use of the grid is reduced. If the battery and solar has efficient software, then the use of the grid will be minimal.
For instance, in the example below, where consumption is in line with the national average, imports from the grid are only 10% of consumption. If most consumers move to this model, how is the grid to be paid for?
I suspect we will find out as my battery, although not particularly economic, is coming soon.

The battery may not be that economic, but provides blackout protection and note that the installation cost at say $1000 is less than 10% of a Powerwall cost.
Maintenance should be fairly low. But the point for this discussion, mainly, is that network connection is arbitraged by the consumer, just as with solar panels. Also, generally there is no “site cost”.
It costs Ausgrid $0.2m plus to install a 250kWh battery
Community battery costs (1) a site has to be found, might be up a pole. Not every street has room for a Megapack especially if the network has no easement. (2) It has to be installed and maintained by well qualified and well paid staff.
For a reference point, installing 25 Powerwalls costs around $25k-$30K. Total capacity is over 300 kWh.
By contrast a community battery costs about 8x-10x as much to install per kWh. Talk about diseconomies of scale.
Here is a graph from KPMG’s 2020 study prepared for Ausgrid on community battery feasibility. I added reference lines for 250 and 500 KWh of capacity.
You are paying $2000/kWh for a 250kWh battery and about $1200/kWh for 500kWh battery.
So a battery about 20x the size of a Powerwall is about 2X as expensive on a per kWh basis. You would quite literally save a bunch of money by buying 25 Powerwalls and installing them in resident properties. Except you probably can’t under the rules
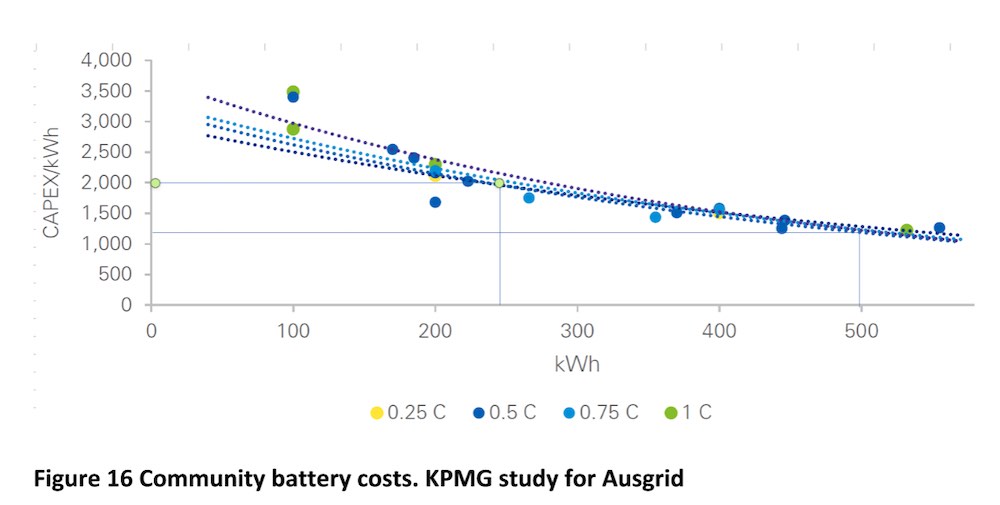
Other information supplied by KPMG shows that for the 250kWh installation, etc, is 45% or about $900/kWh compared to 1000/13 is about $75/kWh for a Powerwall. So for a 250kWh battery, the all-up cost is $0.5 m and the installation+ cubicle cost is $0.2 m.
Western Power/Synergy community batteries are good value for consumers
The leader in community batteries is Western Power which has 13 sites. In sites where a community battery is located consumers can rent either 6 or 8 kWh.
For 8kWh the charge is $1.40 per day or $511 per year. At 5% and for 10 years the present value of that is $3,950 or about $500/kWh.
That’s about half the price of a Powerwall and certainly at a level where at least in my house in Sydney a battery would be clearly economic.
On my arithmetic it would also likely be a money saver for a 6 MWh Syngery WA customer on a time-of-use tariff. Peak electricity on the Synergy tariff is $0.55/kWh.
If you avoid importing 3kWh per day at peak you are ahead ($1.65 grid cost v $1.40 battery charge, add in 3kWh of shoulder charges @ $029 each and you are clearly well ahead)
What we can’t tell from these trials is how the WA Battery cost compares with the numbers KPMG calculated in the Ausgrid study.
A more recent model doesn’t involved consumers at all, but rather involves a distributor putting 40 x 66 kWh of batteries on poles.
United avoids some network upgrades which apparently allows more solar in the battery areas. When not used for network purposes the battery can be used by Simply Energy in the wholesale market.
On the other hand consumers don’t directly get any access to the battery and there doesn’t appear to be any real concept of using the electrons where they are created. Costs in trial programs need to be treated cautiously.