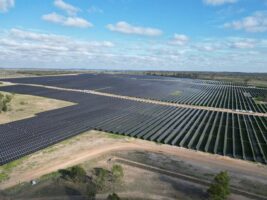
At the earlier Large-Scale Solar Forum I presented analysis ranking solar farm performance based on calculations in our Generator Statistical Digest 2020, and wrote a series of articles for WattClarity (starting here) covering spot revenue, spot revenue considering LGCs, and FCAS costs.
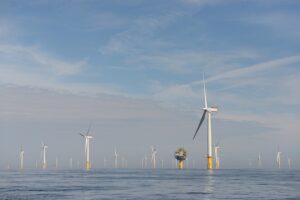
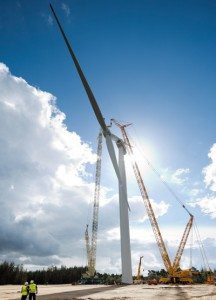
I’ve now prepared similar graphs for the wind farms in the NEM which I’m providing here to coincide with the Clean Energy Council’s Wind Industry Forum.
We’ll be looking into wind and solar farm performance more closely in the Generator Insights 2021 report which we’re currently developing with Greenview Strategic Consulting and others.
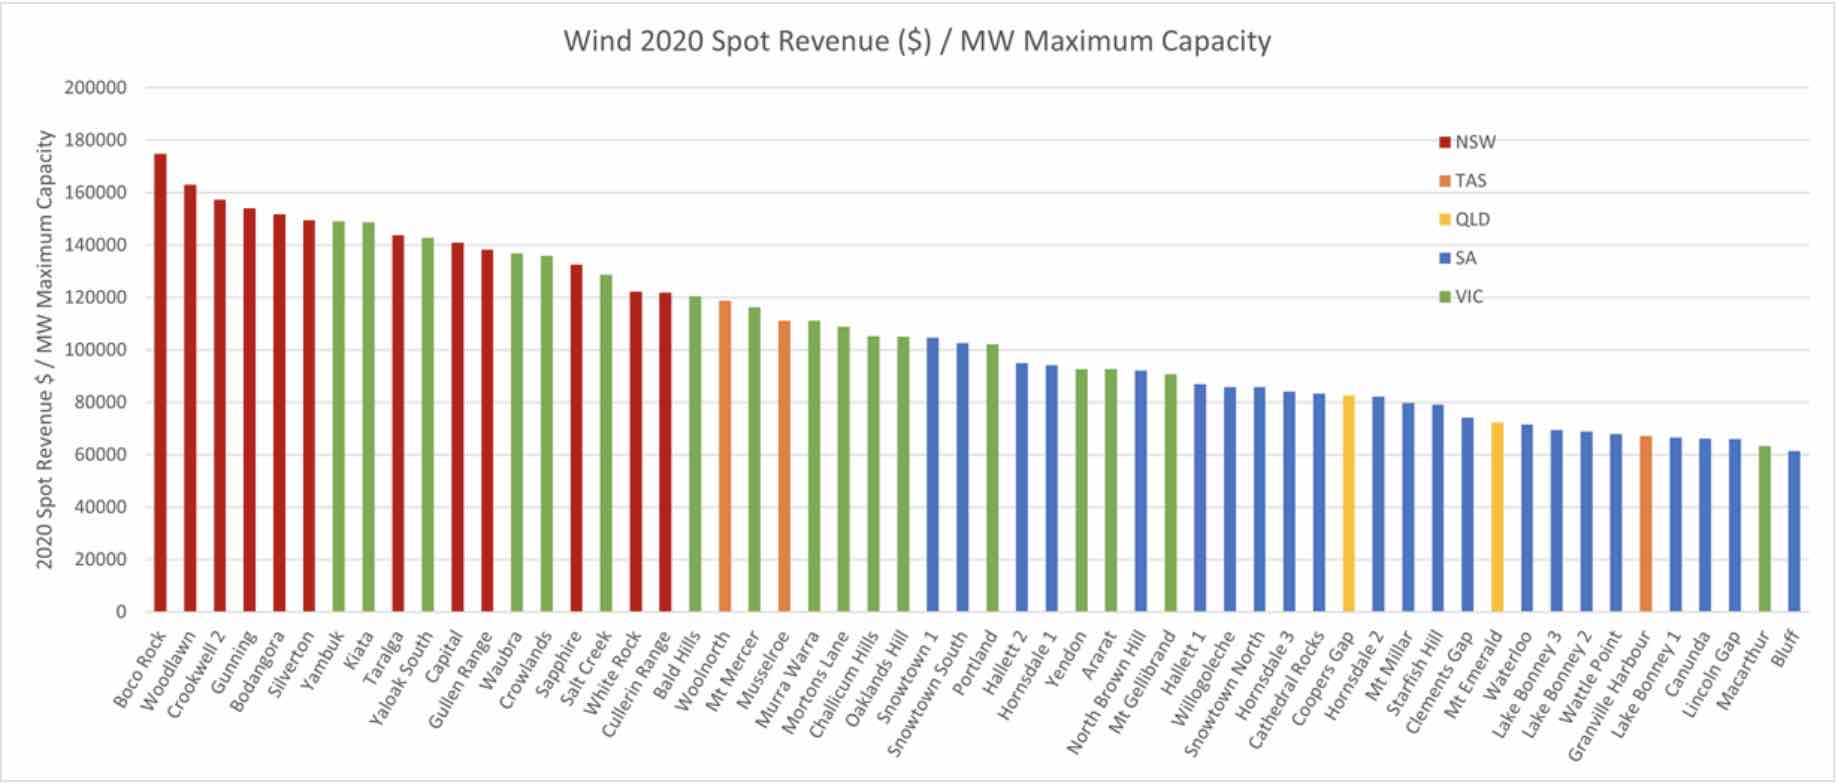
The metric of Revenue per MW of Maximum Capacity attempts to compare estimated spot-market revenue return across farms of different sizes by normalising using MW of Maximum Capacity as a rough proxy to the capital cost.
The comparison here is made using only public data from AEMO’s market systems, so doesn’t take account of a lot of factors (including hedging arrangements, operational costs and green certificate value) that would be needed to calculate the return to the owners.
What it does indicate is the spot market revenue creation ability of the farm, which might not be of much interest to a PPA (Power-purchase agreement)-holding developer, but is of a lot of interest to the offtaker (the counterparty to the PPA), to market-exposed generators, and to investors in future wind farms.
There are lots of reasons for differences in this metric (and in all of the metrics in this article), including:
- average regional prices (such as NSW higher than QLD)
- coincidence of generation timing with prices (particularly when extremely high or negative)
- curtailment due to market constraints (could be short-term outages or longer-term congestion or system strength issues)
- marginal loss factors
- quality of the wind resource
- technical plant performance
- obligations and incentives in a PPA or other hedging arrangements – which may not align exactly with maximising spot energy revenue or minimising FCAS costs
- optimisation of production against FCAS costs
- effectiveness of bidding strategy and implementation
- commissioning status
Some notes on the detail:
- Only wind farms that were operational for all of 2020 are included.
- Spot Revenue is estimated from AEMO public data (using DISPATCH_UNIT_SCADA to estimate generation), accounting for applicable loss factors.
A further step in this analysis is to consider an income source (currently!) of similar magnitude to the spot revenue – the Large Scale Generation certificates. In the corresponding article for solar farms I discuss the calculation methodology in more detail.
Suffice to say here that I’ve taken an average LGC spot value for LGCs generated in 2020 ($38) and multiplied this by the estimated number of LGCs generated.

I’ve also looked at a significant cost to generators – FCAS (Frequency Control Ancillary Services). There’s a lot of discussion in the corresponding solar article about the different types of FCAS and how the costs are recovered from generators.
First, our estimate of FCAS costs for each DUID in 2020, noting some caveats (explored in more detail in the solar article):
- Regulation FCAS is recovered by portfolio not DUID. We’ve defined a methodology based on AEMO’s reported individual FCAS Settlement Factors to allocate a portfolio’s costs across its DUIDs. This is our estimation only and may not match the methodology used by the portfolio’s members.
- Contingency FCAS is recovered by share of generation in each half hour. We don’t have access to the confidential meter data so use the publicly available SCADA snapshot (DISPATCH_UNIT_SCADA) as an estimate.

And a more interesting metric combining the first and third graphs here – a comparison of the percentage of spot revenue spent on FCAS costs – that is, how much of the participant’s spot energy revenue they handed straight back to AEMO!
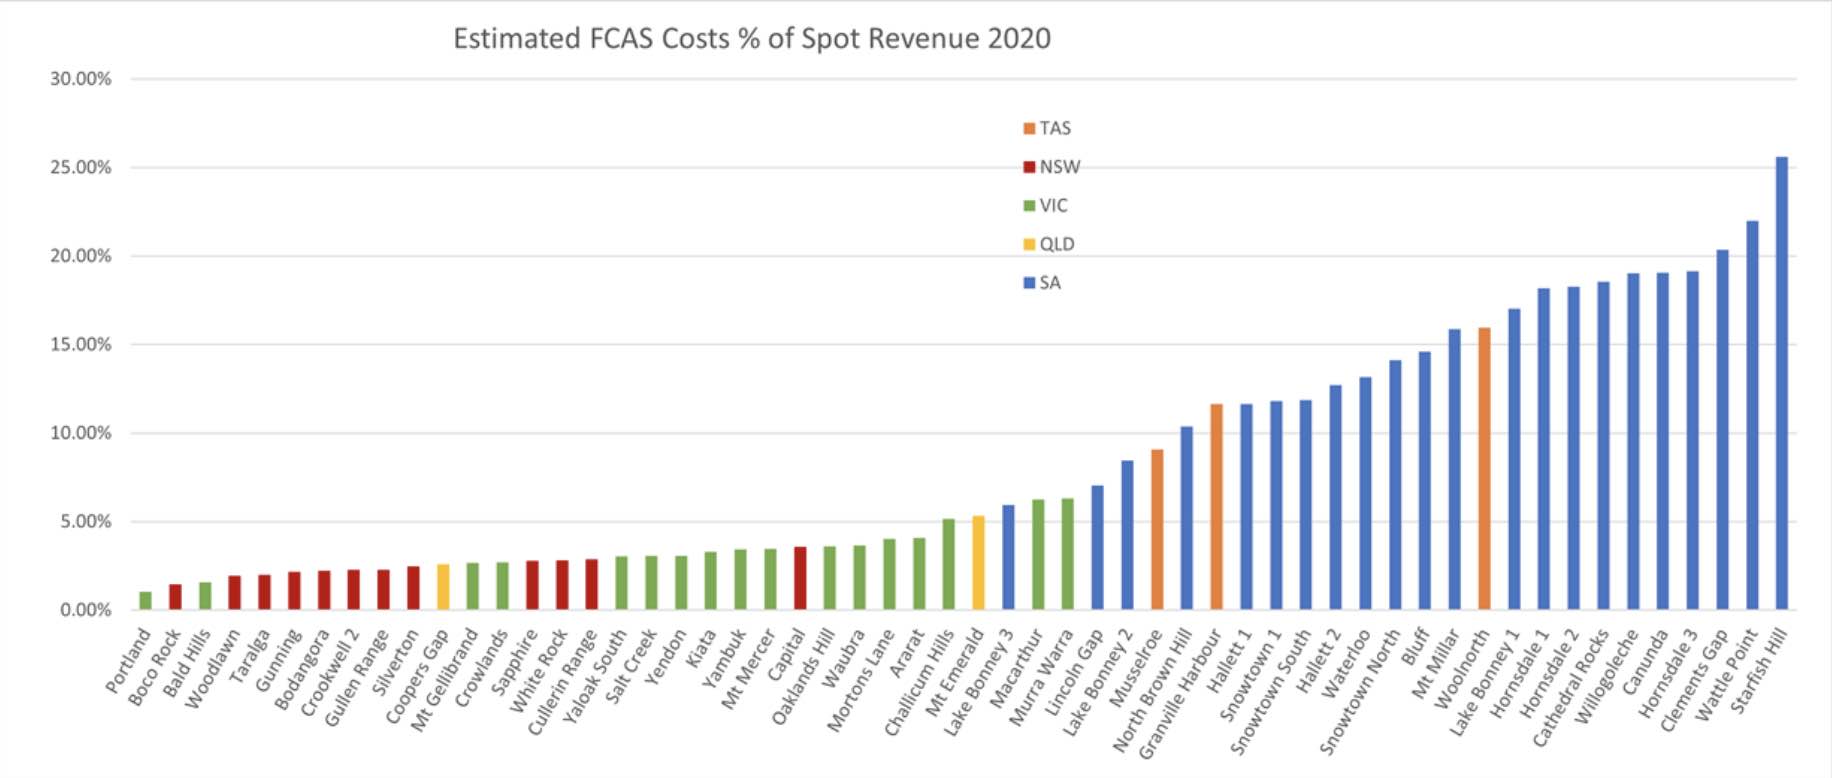
Clearly SA wasn’t a good place to be in 2020 for FCAS costs. Much of the cost you see here for SA was contingency raise costs (and some regulation costs) incurred during the extended separation of SA and VIC in February and March of 2020.
This is discussed in more detail in the corresponding solar article.
Source: WattClarity. Reproduced with permission.