In my recent article for The Conversation I included four noteworthy numbers that capture the scale of the challenges and opportunities of electrifying our transport system:
1. If all Australian vehicles were electric they’d have the energy storage capacity of five Snowy 2.0s, or 10,000 “Tesla Big Batteries.” Equivalently, if 1 in 5 vehicles were electric they’d have the capacity of Snowy 2.0;
2. If all Australian vehicles were electric they’d use more than 60 TWh of electricity a year, which is ~35% of Australia’s electricity consumption;
3. 1 million 7.7 kilowatt chargers could add 25% to NEM peak demand; and
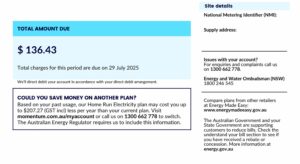
4. A Nissan LEAF may earn roughly $1000 p.a. from the FCAS market.
The word limit of The Conversation article didn’t allow me to detail how I arrived at these numbers, which has led to a stream of inquiries. This article provides the (back of the envelope) derivations.
1. 19 million electric vehicles = 5 Snowy 2.0s
As of the latest census, Australia had 19 million vehicles. Breaking these down into vehicle type and using current battery pack sizes (ignoring that battery capacities are rising) we get the following battery capacities:
14.3m passenger vehicles with 40 kWh batteries = 572 GWh
3.8m freight vehicles with 300 kWh batteries = 1140 GWh
0.14m buses and non-freight carrying trucks with 400 kWh batteries = 56 GWh
0.86m motor cycles with 15kWh batteries = 13 GWh
This brings the total to 1781 GWh, which I’ll round to 1800 GWh (1800,000 MWh).
Snowy 2.0 has a planned capacity of 350 GWh. 1800,000 / 350,000 = 5.14, which I’ll round to 5 times.
The Tesla Big Battery had a capacity (at the time of writing) of 129 MWh. 1800,000 / 129 = 13950, which I’ll round to 10,000 times.
2. 19 million electric vehicles = 35% Australia’s electricity consumption
This calculation is based on the AEMO’s ESOO, whose central scenario sees 4.5m EVs consuming 15 TWh p.a. Scaling this linearly from 4.5m to 19m we arrive at 63 TWh p.a.
Australia’s annual electricity consumption was 182 TWh in 2018-19, so 60 TWh is roughly 35%.
3. 1 million, 7.7 kilowatt chargers = 25% demand
For the past two decades Australia’s NEM peak demand in has sat between 30 and 35 GW.
If operated simultaneously at maximum power rating, 1 million, 7.7 kW chargers would draw 7.7 GW (1 million times 1 kilo is 1 billion). 7.7 / 30 = 25%.
Note that I’m comparing the charger load against peak demand because this gives the lowest percentage. If the hypothetical chargers all engaged during a lull in demand the impacts on the grid would probably be less, however the EVs would constitute >25% of the load at that time.
For context 1 million properties is only roughly one tenth of Australia’s property stock.
4. 1 LEAF (with 7.7 kilowatt charger) = $1000 p.a. FCAS revenue
We looked at the value of the 6 contingency FCAS markets in 2018 in the NSW region and made the simplifying assumption that the charger bids in 7 kW of capacity into each market all of the time. This results in an annual revenue of $2070.
To account for the limited availability of the EVs (while they’re driving) we cut this number in half to $1000 p.a.
Notes. The vehicles in our trial are likely to be available for more than half of the hours in the year, however there is considerable pricing risk due to a large fraction of the FCAS market value occurring during a small number of high price events, which the EVs may not be plugged in for.
The simplifying assumption that the vehicles bid 7 kW into the raise and lower markets is conservative because it neglects that the vehicles will be able to bid the “swing” into the FCAS raise markets (where the majority of the value is) while they are charging. This is because the effective power that they can deliver to the grid is the combination of stopping charging plus the power they can export.
Lastly, 2018 was, as far as recent years go, a reasonably typical year in the FCAS markets (see AER data below). How these markets evolve going forward is hotly discussed as the retirements of synchronous generators is counteracted by an influx of more batteries. Furthermore, the regulations governing frequency control are likely to be updated.

Bjorn Sturmberg is with the Battery Storage & Grid Integration Program, ANU