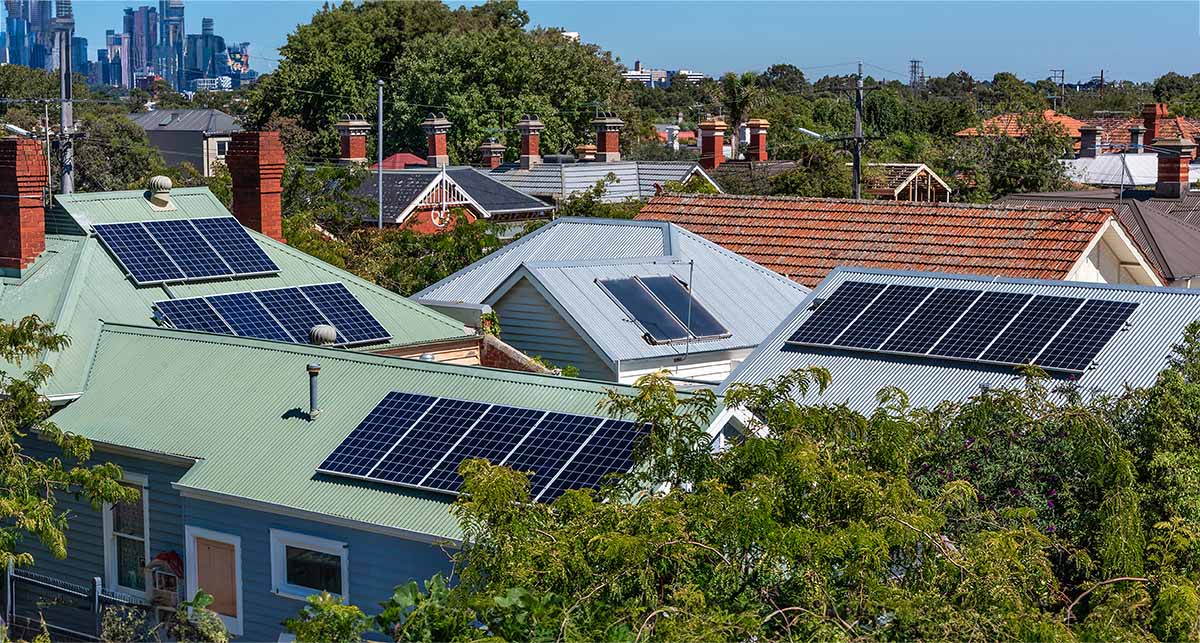
Sunny spring weather has produced a run of renewable energy records over the past week, including a new output high for rooftop solar on Australia’s main grid, the National Electricity Market, beating the previous record by nearly half a gigawatt just three weeks after it was set.
As Geoff Eldridge from Global Power Energy explains in-depth here, the new rooftop solar record for the NEM capped off a “remarkable sequence” of solar and wind records, including new highs for rooftop PV output in three states, and – on the flip-side – record amounts of solar and wind being curtailed.
The sequence culminated on Sunday October 11, says Eldridge, when NEM rooftop PV set an instantaneous output record of 17,488 MW at 12:00pm, surpassing the previous record of 16,993 MW set on September 20 – an increase of 495 MW (+2.91%) in just three weeks.

Compared with the corresponding historical benchmark of 15,100 MW on October 04 in 2025, rooftop PV output was 2,388 MW (+15.81%) higher, Eldridge says.
In New South Wales, a state record for rooftop solar output was set, after it hit an all-time high of 6,346 MW on Friday October 09, besting the previous record of 6,106 MW set nine days earlier, on Sep 30, by 241 MW (+3.94%).
The NSW record followed records set in both South Australia and Victoria last week, starting with SA on Wednesday October 07, where energy generated by rooftop solar in the state passed 2 gigawatt (GW) for the first time and hit a new instantaneous output high of 2,070 MW at 12.30pm.
As Renew Economy reported last week, the second record, also set on the Wednesday, was in Victoria, where rooftop solar output hit a high of 4,191 MW at midday – 155 MW higher (+3.85%) than the previous record of 4,036 MW on 5 January 2026.
But as rooftop solar flooded NEM grids, record amounts of renewable energy from large-scale solar and wind were being curtailed, illustrating both the need for more energy storage and, as Eldridge points out, the scale of available renewable generation that was not dispatched on these record-breaking days.
On Sunday (October 11), for example, Victoria recorded an instantaneous renewable curtailment peak of 5,709 MW at 12:15pm, just 15 minutes after the NEM rooftop PV record was notched up.
“This exceeded Victoria’s previous [curtailment] record of 5,279 MW, set on 20 September 2026, by 430 MW (+8.15%). Against the historical comparison of 4,798 MW on 10 October 2025, the increase was 911 MW (+18.98%),” Eldridge writes.
Other records included NEM wind curtailment of 6,425 MW, Victoria wind curtailment of 4,229 MW, Victoria solar curtailment of 1,554 MW and South Australia wind curtailment of 1,910 MW.

The above chart illustrates the midday curtailment profile through the pink “Dolphin Curve,” showing how much available renewable generation was not dispatched.
As Eldridge explains in more detail here, “the shape provides a useful visual counterpart to the familiar Duck Curve, drawing attention to renewable energy availability beyond dispatched generation. The concept is explored further in the NEMLog explanation and RenewEconomy’s Dolphin Curve feature.”
Read Geoff Eldridge’s full analysis here.
If you would like to join more than 29,000 others and get the latest clean energy news delivered straight to your inbox, for free, please click here to subscribe to our free daily newsletter.