News of the week
CEC Summit was once again sold out with over 600 delegates.
There was a clearly upbeat theme, only to be expected as renewable energy is booming, and politicians of all shades are clearly taking electricity and clean electricity seriously.
There seemed strong support from attendees for Finkel (the amount of support was surprising in my opinion) and although the majority of presentations dealt with in front of the meter issues my own personal, off the cuff, unrepresentative survey of about 30 smart people in a one room, suggested that most thought behind the grid electricity would be relatively more competitive.
In other words, it would be relatively cheaper compared to grid delivered electricity than it is today.
That said battery prices have been sticky in the year to date.
Transgrid, with new owners and a new CEO, is clearly thinking hard and arguably embracing more in front of the meter renewable energy for NSW.
Why wouldn’t they?
There’s lots of transmission investment in it. And as we have pointed out transmission isn’t that important in customer bills.
It’s a big conference with several streams going at once, so hard to get across all the bits and pieces, but things to catch this analyst eye included:
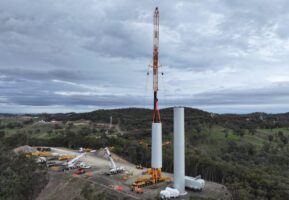
Windlab’s Kennedy Energy Park. Stage 2 of this park would have 1200 MW of wind & PV at a capital cost over $2 billion.
The interesting point is that Windlab expects the combined capacity factor of putting wind and PV together to be over 65 per cent.
We note that the AFR is reporting that Windlab is looking at an IPO (public listing). No doubt that might help a bit with the equity needed for a $2 bn project.
Windlab states Kennedy stage 2 would result in a 10 per cent reduction in Qld’s Community Service Obligation [CSO].
The CSO is over $500 million per year in QLD so this is a potentially significant saving although still only 2.5 per cent of the project capital cost.
However, the bigger point is that the project can’t/won’t proceed until there is some certainty around around the transmission build out of the $350 m Powering North Queensland Plan.
At the moment, as Energy Queensland separately stated, that plan is little more than a line on a map right now.
At the end of the current link (Julia Creek) no more than a few MW can be added without blowing up the system.
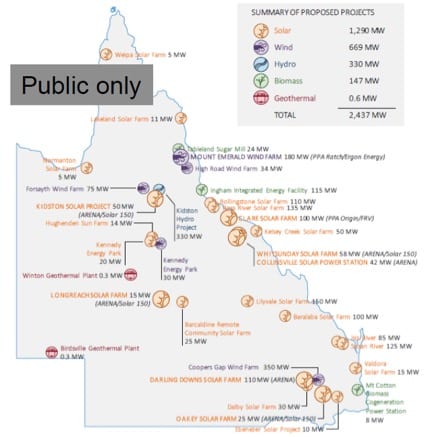
To give an idea of what renewable energy can do for jobs and regional development in Qld check out this image from Don Mcphail’s Ergon presentation.
This really should be nailed on the wall of politicians looking for votes in these important and often marginal seats.

Global warming – April 0.9C, May 0.83 C, June 0.82 C
The 20 year (240 month) moving average shows June 2017 at 0.64 deg warmer than the 20th Century average.
An Excel generated polynomial trend puts the June 2017 at around 0.77 degrees. The 20 year moving average has moved up relentlessly since the 1950s.
We would definitely get grumpy if cuts in the USA budget were to mean this data wasn’t provided or wasn’t provided in such a timely and useful fashion as previously.

Turning to the weekly action
- Volumes: Were stronger this week particularly in NSW and Victoria and I guess driven by colder weather. Overall though grid delivered volumes aren’t doing much.
- Future prices rose a touch. We are now, in this analyst’s opinion, in a holding pattern waiting for evidence of policy and the impact of new supply to show up.
- Spot electricity prices South Australian prices although much higher than other States were actually down a bit on PCP almost certainly because gas prices are lower. Gas is still setting the price most of the time in South Aust. but it’s a lower price. On the other hand, gas is setting the price in Victoria most of the time and its 150% higher (in the spot market) than last year. Victoria still needs quite a bit more wind to get started before it can make the required inroads on gas. Electricity prices in QLD are well below levels of the other States at present. Not just because of the new Stanwell policy but also because gas prices in the State are lower than they have been.
- REC No change.
- Gas prices were lower than last year other than in Sydney. Gas prices in QLD are now “only” in the $6.50 GJ range. Sydney gas prices did jump a bit. Overall though Fig 14 makes it clear that so far this Winter gas prices have not been any cause for drama.
- Utility share prices. Were broadly soft. The broader share market was down 1% and with the ongoing exception of Genex (on a bit of a tear) there was little of interest or excitement. Discussion by AGL & ORG CEO’s at the CEC conference added little or no value to the conversation.

Figure 3: Summary
Share Prices

Figure 4 Selected utility share prices


Baseload Futures, $MWH

Gas Prices


David Leitch is principal of ITK. He was formerly a Utility Analyst for leading investment banks over the past 30 years. The views expressed are his own. Please note our new section, Energy Markets, which will include analysis from Leitch on the energy markets and broader energy issues. And also note our live generation widget, and the APVI solar contribution.