Much like the looming summer and the threat of bushfires that it brings, the Calender 2020 LGC (large scale generation certificates) market has been primed, waiting for the spark that would set it alight.
Yet despite further tightening in the predicted LGC surplus for the current compliance period, the spark has not yet come. With little over two months remaining until the final surrender date, the deadline for both buyers and sellers is fast approaching.
 The discussion around the LGC surplus has been both highly relevant and well documented across 2019 and 2020. In both years, substantial surpluses were forecast at the start of the year before a combination of factors including project delays, persistent curtailments and other network issues (among others) conspired to shrink that surplus progressively across each year.
Given the extent of focus in recent times, a quick look at forecasting LGC surpluses/deficits may be valuable to some. At its simplest level, the surplus in a given year is the total LGCs rolled into that year plus the total LGCs produced in that year (supply), less that year’s target (demand). The LGC target is outlined in the legislation and is generally a known variable depicted by the Renewable Power Percentage each March. So too is the number of LGCs rolled into the year.
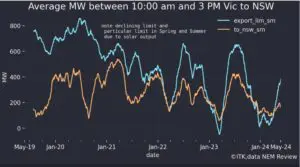
Where things become a bit trickier, particularly in recent years, is forecasting the year’s LGC production. While forecasting output from existing projects is not overly challenging, issues such as curtailments, which see projects’ output reduced to ensure grid security/integrity can have a massive cumulative impact.
Each time a project’s output is reduced it reduces the expected LGC output for the year. Add up such reductions across a dozen or two projects over many days, weeks and even months and it’s easier to see why projected supply and hence, projected surpluses have shrunk across both of the last two years.
The other factor which has a tended to have a similar effect in recent years is the commissioning date of new projects. Assumptions are made at the start of the year as to when each project in the pipeline will come online and at what proportion of its full capacity. As is often the case, a variety of factors including achieving grid connection can push back the date at which a project officially comes online and begins generating LGCs. Each time this happens, expected LGC output for that year is reduced.
To tie this discussion into a more concrete example using 2020 as a case study, at the beginning of the year forecasters such as Green Energy Markets had been projecting a circa 8 million LGC surplus. By the middle of this year that figure had tumbled to 2 million. More recently it had fallen further to a wafer thin 300,000. Should similar trends continue until the end of the year, that surplus could easily become a deficit.

While this tightening trend had caused a considerable jump in the spot/Cal 20 LGC market in late August (reaching the $50 mark in the Cal 20 contract), it subsequently softened considerably stabilising at lower levels in the $37-$40 range across November. One explanation for this is that, as
in each of the last four years, some scheme participants are expected to pay the penalty instead of complying, thus leaving additional LGCs available and potentially providing a buffer to the surplus.
The extent of such under surrenders (or short falling, as it is known) in this scenario would be all-important. A small under surrender would mean the market remains very tight and a repeat of the fireworks seen in the lead up to Cal 19 compliance could occur. A large under surrender and the
pressure would be off.
Another explanation however is that buyers are biding their time, waiting for further information as well as to see if prices comes down any further before coming to market. If this is the case and the market ends up being very tight, it may provide the spark that many have been anticipating, with the wild price movements seen earlier this year the potential result.
While the spot/Cal 20 market has been softer, longer dated forward contracts have climbed, with the Cal 22s at $25.25, Cal 23s at $15.50 and the Cal 24s even climbing to $7.50. Given the size of the projected surpluses from Cal 22 onwards, strengthening prices in the back end of the curve seem
baffling to many. Yet the timing of entry to the market can play a large role in the short term, with buyers sometimes having to come to market at times when sellers are not present. Oh for a crystal ball.

For the second consecutive quarter, the latter part of Q3 failed to yield higher spot STC prices, with the market instead falling across October on strong submission numbers and the weight of the growing surplus. November then brought price stability as the typical end of year jump in STCs
submissions arrived.
It is often the belief among sellers in the spot STC market that waiting until the latter part of the quarter will yield the highest STC prices. While that that is sometimes the case, Quarters 2 and 3 for 2020 have failed to deliver such outcomes, with prices peaking much earlier in the quarter on both
occasions.
In Q2 the market peaked at $39.65 in early June, only to soften to the mid $38s by mid-July (the 28th of July being the final compliance date for Q2). In Q3 the spot rallied fleetingly to $39 in mid-September before promptly softening back to the mid $38s and reaching $37.95 by mid-October
(final date for Q3 surrender being the 28 th October).
Across November the market found a level at $37.75, enjoying its most stable run of activity for the year with 23 days unbroken at that price.

There is one maxim that has rung true in 2020 however, despite all that has happened this year. The significant growth in STC submissions that tends to take place in the final months of the year has once again occurred. The weekly average STC submissions across the four weeks of November was
992k, a whopping 286k per week above the 706k required by the target, adding 1.14m STCs to 2020 surplus.
That surplus now appears likely to exceed 10m STCs, which would need to be added to the 2021 target, thus implying a target for 2021 substantially larger than the one set in 2020. No doubt this will induce some speculation as to the palatability of the fourth consecutive year of growth in the Small-scale Technology Percentage (STP), in the eye of the minister and the likelihood that he would seek to influence the target setting process to achieve a different outcome.
Marco Stella is Senior Broker, Environmental Markets at TFS Green Australia. The TFS Green Australia team provides project and transactional environmental market brokerage and data services across all domestic and international renewable energy, energy efficiency and carbon markets.