We argue that the modelling results the Energy Security Board has presented in favour of the National Energy Guarantee look, kindly put, implausible. One of the aphorisms used by the smart fund managers when presented with some chart at odds with the real world was:
“If it looks wrong it probably is”
And if it probably is wrong it’s pretty dumb to rely on it.
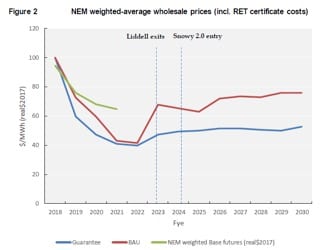
We think the forecast that wholesale prices are going back to $40/MWh in 2020/2021 is unlikely. Based on the generation investment projections we also think the forecast of wholesale prices to average around $50/MWh real in the 2022-2030 period is also unlikely. We think the BAU case is a straw man that could never occur in the real world.
Even if those forecasts do come true, we don’t see reliability as improving as the implication is that coal stations will continue to age, have to operate with lower average levels of profit.
This will make maintenance spending difficult to justify. . By 2030 three more coal generators will be in the oldest 1 per cent in the world.
In short, to keep prices down requires more investment than contemplated by the ESB.
To keep the system reliable requires better planning for the replacement of most of the NSW coal generators and the significant share of capacity represented by Yallourn in Victoria and Gladstone in QLD.

Forcing square pegs into round holes
However it’s dressed up, the NEG involves a partial abandonment of the market in favour of a forced generation mix. No longer can retailers choose how to operate, they are being mandated. The system is being centrally planned.
The long and the short of it is that we still think there is a good case for going back to square one and designing a system based on minimising the consumer costs of achieving the energy trilemma, low emissions, high reliability, efficient costs.
Still, in this note we focus mostly on the wholesale price forecasts that the ESB is now responsible for.
We didn’t speak to Frontier Economics about the modelling done for the ESB but we did speak to a modelling consultant, an electricity broker, and an two industry consultants.
None of them were supportive of the modelling results. The market clearly doesn’t yet believe that the ESB’s forecasts will yet come to pass. If they did, the futures market would adjust sharply.
Higher contracting is the silver bullet. It’s magic
Modelling done by Frontier Economics at the request of the ESB assumes that if generators are forced to increase contract levels they will compete to be dispatched and this will lead to falls in spot prices.
Contract prices will then reflect spot prices leading to prices falling towards SRMC. This is the key philosophy underlying what otherwise seems to be the miraculous claim that under the NEG wholesale prices, including peak premiums and REC costs will fall back to average $40/MWh in 2020 and 2021.
This compares with a baseload futures price of around $65/MWh. Following the Liddell closure with next to no new investment prices will then go to $50/MWh and stay there.
If we were COAG we would ask the ESB to get not one but two additional models done. After all, Frontier Economics models have made bizarre predictions in the past.
Under an EIS renewables investment was going to stop and gas was going to replace coal. No-one believed that, not even the gas generators. The futures market implies participants don’t believe the current Frontier forecasts and as such provide a credible reason for COAG to get some alternative forecasts.
BAU will never happen – it’s a strawman. We call BS
Notwithstanding what we see as highly questionable assumptions about prices and investment under the BAU case, the fact is that BAU can’t happen if the Federal Government is to achieve its emission mechanism targets. Some mechanism has to be found for creating the new renewable investment.
We would also argue that if retailers perceived that they couldn’t meet their demand, that is they perceived a reliability risk, they would contract at higher levels.
The modelling in this report implicitly argues that gentailers and retailers are operating inefficiently by being under contracted. However, no evidence is presented for that view.
Alternatively the report could be taken as implicitly assuming that the gentailers are acting in an oligopolistic manner and with holding supply from the market. Again, no evidence is presented for this view.
Instead, what it amounts to is an attempt to force generators to run at a higher rate. In practice it seems to this analyst the only way that can force prices down is if coal generation forces out gas.
However, Victorian generators are running flat out. QLD generators are already running to keep prices low and have limited further ability to influence prices in NSW and Victoria. This only leaves NSW coal generators to do the job of forcing out gas in Victoria, because that is what it amounts to.
The modelling magic pudding: prices fall, no investment
Coal generators that were closing last time electricity prices were $40/MWh are now going to stay open until 2030 even though they will be operating harder and getting older. By 2030, 3 more coal fired generators will be in the oldest 1% (that is more than 50 years old) of coal fired generators in the world.
We don’t know what Frontier is forecasting for peak electricity prices but the outlook for gas fired generation is unlikely to be wonderful if average prices are $40/MWh. If gas fired generation is contracted and therefore has to be dispatched will it really sell into the spot market at a loss?
As for pumped hydro our modelling estimates that even “cheap” plants need a spread between peak and off peak prices of around $80-$90/MWh to justify the investment.
Snowy 2.0 will undoubtedly be more expensive than most pumped hydro plants due to its 9 km of hard rock tunnelling and relatively low “head”. So good luck getting the off peak- peak spread on these forecasts.
Rooftop PV investment, although not specifically broken out, looks as if is modelled to at least halve in its growth projectory.
In short, it’s not going to be much fun being a generator, or someone working behind the meter. The rooftop PV industry will see mass unemployment, the utility scale wind & PV industry likewise.
Wholesale prices are modelled to fall dramatically, to half what the futures market is trading at
According to the modelling wholesale prices including REC costs are going to fall to about $40-42/MWh by 2021. NSW 2021 baseload futures for 2021, never mind peak and REC price add ons, are currently sitting at $71/MWh.
Even in QLD 2020 baseload futures are trading today at $65/MWh. So on this basis someone is going to lose a lot of money. Ie the market, thin as it is, currently thinks electricity will be 60% more expensive than assumed under the modelling, and that is for a BAU situation.
Either the market or the model is badly wrong. On the basis of its modelling Frontier Economics should be selling futures left, right and centre.
This is a typical example where reading the text of the report gives a misleading view. The text of the report states “This price decline is also reflected in the price of baseload futures contracts”.
It’s true that the futures price curve declines but nothing like as much as the modelling. And the base load futures don’t include the significant peak premiums and RET costs in that year.
And this matters. If the price is $40/MWh not much generation will be built. If it’s $70/MWh quite a lot will be.
We only had to read up to page 5 of the ESB report to start getting really grumpy.
Prices falls because of higher levels of contracting
The modelling forecasts lower spot prices essentially because higher levels of contracted generation incentives dispatchable generators to be dispatched.
In aggregate of course no more dispatchable generation will be dispatched. If renewables aren’t constrained they will continue with their share of supply and dispatchable generation will get what’s left.
If generators are forced in aggregate to contract more supply than there is demand some will miss out. As this will have a financial cost they will compete to be dispatched lowering prices. It’s a game of musical chairs.
The modelling assumes contracted levels of generation will be increased by 5%. But how much generation is contracted already?
Prices could only fall back to an average of $40 MWh without gas
In Victoria at the moment gas and hydro on average provide some power every half hour. Gas is not going to be bid in at SRMC. Even if was it needs more than $40/MWh when gas prices are higher than say $6 GJ delivered. Gas prices were $3 GJ last time electricity prices were $40/MWh.
If the gas generators have to be contracted, as part of the reliability guarantees they aren’t going to do it for that price or anything like it.
Generation investment according to the ESB
Under the guarantee there is said to be more generation built than under BAU.
We’ve recast Table 1 from the ESB report to COAG from a ten year total to annual average by dividing by ten. Under BAU according the modelling the there will only be 60MW renewables per year, whereas rooftop PV alone has averaged say 650 MW per year over the last five years.
Under the guarantee new renewables of all sorts is 400MW per year. That is less than rooftop PV alone has been doing.
Actually what this table does raise as a question is the fate of the SREC scheme. Batteries are included as dispatchable renewables, but they and pumped hydro are net consumers not net generators. Still that is perhaps semantics.

These new generation commitments are in addition to Snowy 2,0, Genex pumped hydro or equivalent in South Australia and the SolarReserve solar thermal plant in South Australia.
We point out at this stage that Snowy 2 is useless to South Australia due to transmission constraints and probably can’t do much for QLD.
Snowy 2 will be competing with Snowy 1, Southern Hydro and gas for the peaking market in the NEM. Obviously the SRMC of Snowy 2 (as pumped hydro) will be higher than conventional hydro costs (zero) and gas.
Let’s move on the next assumption that there are no more coal retirements beyond Liddell.
The world’s oldest coal fleet will be its most reliable?
According to research done by AGL’s Tim Nelson, <1% of coal generators internationally are more than 50 years old. So any generator commissioned after 1980 in the NEM will be in the oldest 1% in the world by that point.
This includes Vales Point, most of Yallourn, Gladstone, Yabulu. Eraring and Bayswater were commissioned in 1982 Tarong in 1984.
So even ignoring the likely steeply increasing cost of global warming over the next 13 years, about 4500 MW of the coal fleet will be right at the end of its actuarily likely life.
Is the reliability of this fleet likely to get better or worse one wonders? Is an ageing fleet likely to be better or worse at flexing up and down as renewables penetration increases?

The capacity weighted average age of the fleet will be 42 years, but QLD holds this down in NSW its 4 years and in Victoria nearly 45.
Of course, it’s not just the age of the plants but the coal mines supplying them will generally be less economic. Operating costs would normally be expected to rise and reliability fall as the plants get older.
Only NSW coal generators can provide more output
We still don’t have a full 12 months of NEM operation without Hazelwood still we can say that, with Liddell operating NSW coal generators have run at about 70% capacity factor in the past 12 months. That will rise in 2022 anyway as Liddell closes.
David Leitch is principal of ITK. He was formerly a Utility Analyst for leading investment banks over the past 30 years. The views expressed are his own. Please note our new section, Energy Markets, which will include analysis from Leitch on the energy markets and broader energy issues. And also note our live generation widget, and the APVI solar contribution.