Tesla battery and “hidden demand” added to popular NEM-Watch

Screen Shot 2017-12-07 at 1.17.28 PM

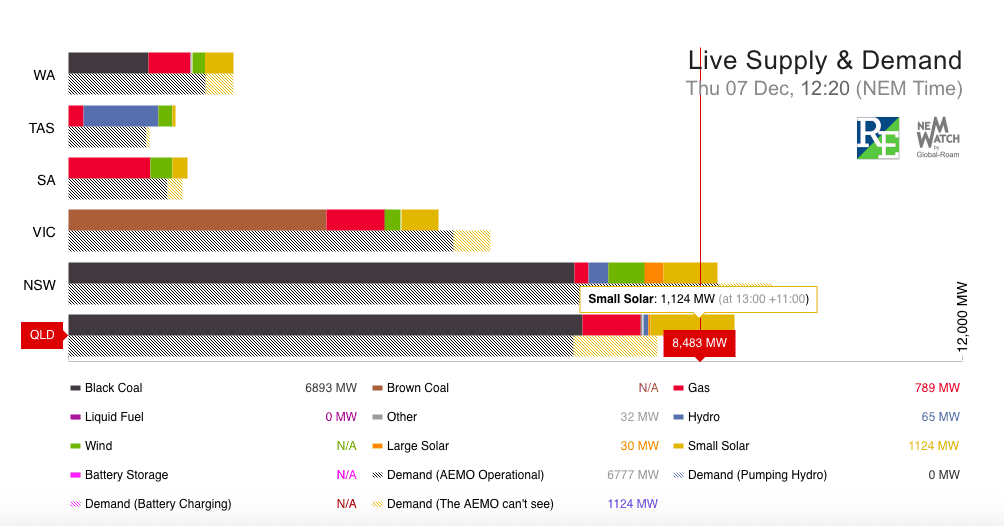
Two significant new additions have been made to the highly popular NEM-Watch feature on RenewEconomy’s pages, with the addition of data from the Tesla big battery, and the addition of state demand levels, including the “hidden demand” from rooftop solar PV.

The additions have been made by RenewEconomy’s partners in the project, the data specialists Global-Roam.

It’s quite something to have the battery storage added, because the 100MW/129MWh facility can both draw down and put into the grid, and can switch in a matter of seconds.

It’s not the only technology storing energy, however, and the update also adds in the “loading” of pumped hydro facilities, when water is pumped up hill during times of low demand, and presumably lower prices, until a peak event requires the water to cascade back down and spin a turbine and create electricity.

The demand data (in the second row for each state grid) was added because it is a significant component of the workings of the National Energy Market, and which states have to draw on generation elsewhere, or are exporting to neighbouring grids.

You will notice that the WA grid, which is isolated, must always perfectly match demand and supply, as the NEM needs to overall.

AEMO, the market operator, actually has little visibility over the 6GW of rooftop solar on the grid, and the amount that is “self consumed”.

But its presence on the graph – the demand that AEMO can’t see – is an important feature of how grids will be managed, so it’s inclusion is valuable.

The additions will also be included on the live widget on the home and story pages in the next week or so.

We hope you enjoy the new additions to the NEM-Watch feature, and enjoy watching as much as we do as the share of green (wind), yellow and gold (large and small scale PV) continue to grow, along with storage.

Comments

24 responses to “Tesla battery and “hidden demand” added to popular NEM-Watch”

  1. Mark Potochnik Avatar
    Mark Potochnik

    Many of US understand the future demand of battery systems. Why we hold on to Tesla stock when it crashes….

  2. MaxG Avatar
    MaxG

    Thanks for pointing out NEMwatch again; just spend 30 minutes looking through the graphs. 🙂

  3. Joe Avatar
    Joe

    Way too much Black and Brown colouring.

    1. rob Avatar
      rob

      TO true Joe, none of that here in S.A. but we still have the red……..but slowly and surely we are going to move on to 100% Green and Gold! Keep an eye on little old S.A.
      Cheers rob

      1. Joe Avatar
        Joe

        Rob, I live in Sydney and I always have one eye on what is happening in SA. After Elon and Jay’s Big Battery the two things I am wetting myself with excitement about is The Liberty Steel project, to show those COALition dickheads that you CAN make the steel from solar and wind energy. The other one is The Solar Thermal. SA is the ‘pathfinder’ and what happens there will be copied by the other states.

        1. rob Avatar
          rob

          And the world!

  4. Steve159 Avatar
    Steve159

    Can someone explain what “demand that AEMO can’t see” actually means.

    1. Carl Raymond S Avatar
      Carl Raymond S

      Yes, is the chart drawn from actual data, or is it estimated? If drawn from actual data, surely AEMO would have access to that data. If it’s estimated, is that estimate based purely on time or day, or does it factor cloud cover?

      1. Charles Avatar
        Charles

        The data comes from http://apvi.org.au/ – more information at their website.

    2. Ken Avatar
      Ken

      The consumers that have roof top solar will be self consuming some of that solar generation, and any surplus will be feeding into the grid.

      AEMO does not have access to that metering,, so they don’t know how much is being self consumed and how much is being generated.
      As a result the demand is being masked due to the roof top solar.

      AEMOs problem is that they have to be able to supply that demand when and in the event that the solar stops generating ( cloud over, sun goes down etc.), so this could lead to steep ramp rates for grid connected generators, as is demonstrated by the duck curve.

      Actually pretty easily fixed by the installation of proper smart metering that is internet connected with that info fed back to AEMO where they can aggregrate all that metered data and then be able to ‘see’ that demand.

      1. Steve159 Avatar
        Steve159

        “they have to be able to supply that demand when and in the event that the solar stops generating”

        So they are, in effect, guessing potential demand, should cloud cover drop roof-top solar output?

        It seems inevitable that for a stable grid, smart metering / net connected will be mandated, at some stage.

        1. Greg Hudson Avatar
          Greg Hudson

          Smart meters have been mandated for years in Vic. Mine cost me over $1k (no explanation as the WHY it was that high though). Best $1k I ever spent. Doing so reduced my $1800/year bill to $163 due to the exports from my 2kW PV array, and a Premium FIT. I’ve moved houses twice since then, and I’m now looking to install 10kW+ (or as large as I can fit onto my new roof – North facing, no tree shadowing). Configuring is proving to be problematic… I’d like 2 strings, each feeding into their own inverter. One inverter supplying everything to the grid (approx 20kWh/day average for Melb). The other inverter to supply the house requirements (10kWh/day) + a Tesla PowerWall2, and a Tesla Model 3 if it ever arrives. Budget is still unknown, but probably in the order of $20k
          If anyone here can assist… I’m looking for solutions !
          A blockchain retailer would also be nice 😉

          1. rob Avatar
            rob

            If you can get a 10 Kw system, 2 inverters and a powerwall 2 never mind 3 you are dreaming! ( if you want half decent equipment) that is! If you are successful please let me know!
            cheers rob

    3. Craig Allen Avatar
      Craig Allen

      It’s exactly equal to small solar in each state. (I don’t understand why.)

      1. Steve159 Avatar
        Steve159

        Nor I

        Presumably, there are a number of factors affecting that figure. E.g. if X kWh is being output to the grid, and there’s a heat wave with lots of air-conditioners being switched on, then that output would drop. Then cloud cover could also drop that further (inversion layer event) etc.

        I don’t understand how they work all that out.

        Giles, how about an article detailing all this. It seems I’m not the only one in the dark (pun unintended).

  5. Craig Allen Avatar
    Craig Allen

    As I type this (5:15 EST) in WA demand the AEMO can’t see is equal to small scale solar generation. Does this mean that solar households are in aggregate coincidentally using as much electricity as they are generating (although of course some will be in excess and some in deficit)?

    1. Charles Avatar
      Charles

      That’s a very good question and even though I have been following this chart for some time I hadn’t thought about this.
      I believe the way it works is that the excess that flows back to the grid is consumed by other households on the same distribution network segment before it gets back to a point where the demand is metered and reported to AEMO (not sure if this is the local distribution substation or somewhere else). Effectively the solar that is fed back to the grid is also “un-seen” by AEMO – not just the household with the solar itself.
      Hopefully Giles or someone else can give a more accurate response!

    2. Craig Allen Avatar
      Craig Allen

      Ah, now I’ve realised that in every state ‘demand the AEMO can’t see’ is exactly equal to ‘small solar’ (10am EST as I type). Perhaps if solar households and businesses in aggregate in a state are using more then they are generating then by definition they are using all their own generation?

  6. solarguy Avatar
    solarguy

    Sure will enjoy it sports fans!

  7. neroden Avatar
    neroden

    Whee!

    Now can VIC please get rid of that horrible brown blotch?

    And why aren’t there any wind turbines in Queensland?

    1. Steve159 Avatar
      Steve159

      I think, wind-wise, less of it the further North one goes, except for cyclones and the like

    2. trackdaze Avatar
      trackdaze

      Tony A$$bot scared about 1.8billion dollars worth and its commensurate jobs away in 2013.

      Think there is some coming online next year.

    3. David Osmond Avatar
      David Osmond

      There will be soon, Mt Emerald, Coopers Gap and Kennedy all currently under construction, will add about 700 MW of wind to QLD. Windy Hill has also been operating in QLD for many years, but it is very small and doesn’t appear on the widget.

  8. Tom Avatar
    Tom

    Just checked out the new NEM-Watch site. It’s fantastic! Thank you to whoever modified it.

Get up to 3 quotes from pre-vetted solar (and battery) installers.