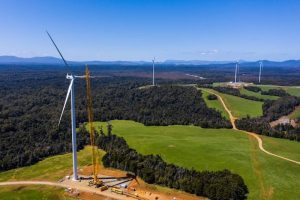
Large-scale Generation Certificate (LGCs)

That signs of stability appeared in the LGC price in October came as no surprise given how high the spot had risen in relation to the scheme penalty. Yet the extent of the softening that followed in November certainly caught people’s attention prompting many to speculate as to the rationale.
Since early 2015, when it became clear that a bipartisan compromise on the reduction of the RET would likely occur, the LGC market has rallied almost relentlessly toward the tax effective penalty level of $92.85. Along the way, there have been some hiccups, most notably when the spot market broached the $84 level in late January, before proceeding to soften to $79 by mid February and then surviving a volatile period to finally reach the $84 mark in late June.
Those who saw the January rally as an overshoot may very well consider what happened in the new financial year as a more gradual and measured example of the same phenomenon; that is, that while the status quo is maintained, the spot market will continue to progress towards the tax effective penalty level ($92.85), which will be reached at the time that there are not sufficient LGCs available for surrender.
Yet at times, if the spot moves too high, it robs buyers of any incentive to purchase, given the cost of carrying those LGCs out to the relevant surrender date, whilst also eliminating room for any risk margin.
The spot LGC market opened November at $89.40 and initially began a modest softening on very low trade volumes across the first week. From there however, the lack of buying interest became more acute and what followed was a 9 day losing streak that saw the market slump to $86.00, a 4% drop on the $89.50 high reached in October and a low not seen since early August.
Late in the month some support did re-emerge with activity in the $85.90-$86.00 range returning some confidence to market, ultimately bringing the month to a close at $85.90.
With the spot falling, the forward curve also came down however the reduction in price allowed the escalation on the Cal 16 and Cal 17 in particular to (which had previously been squeezed by the tax effective penalty) increase from (at times) below 2% to something closer to 3% by month end.
Interestingly, the back end of the curve (which had been backwardated for some time) did not soften as much as the earlier vintages, with the Cal 18 last trading at $87.85, only $1.00 below its high and the Cal 19 market (implied) around $83.00, $2 below the high it reached earlier in the month.
The disappearance of buyers was the major contributor to November’s losses, with buyers who were previously content to accumulate only weeks earlier, no longer present. But the softening LGC price also brought out sellers who may very well have previously lacked motivation, given the unwavering pricing strength that preceded the drop.
Ostensibly, November’s losses appear not to have coincided with any substantive changes to the demand/supply equation.
There has been no meaningful indication that those in the Turnbull Government who would like to get rid of the RET have achieved any ascendency, nor that even if they had would they be able to amend the RET legislation in time to influence the setting of the 2017 Renewable Power Percentage (the scheme’s target), thus reducing it and potentially avoiding an effective shortfall outcome in Cal 17.
Neither has there been any significant change to the supply side, with project commitments thus far barely making a dent on the thousands of megawatts of capacity that were required to be committed in recent years to prevent a shortfall event.
In short, the softening LGC price doesn’t appear to be based upon the likelihood of a tangible change to the status quo of an effective shortfall in Cal 17, but instead is more of a reflection of buyers wanting a greater financial reward in order to purchase and carry LGCs out to future compliance periods. The softening LGC price affords them that, whilst also pricing in a fairly modest margin to reflect the (albeit improbable) risk that a shortfall event does not take place.
Small-scale Technology Certificates (STCs)

Following the surprise run of activity in the forward STC market across October, the market returned to a quieter environment in November, with the most notable outcomes an uptick in STC submissions and a large spot transaction.
In terms of trade activity November failed to see a continuation of the resurgence in forward market action, with a 50k spot transaction at $40.00 the most exciting talking point. Yet in terms of STC submissions, November was significant with 3 of the 5 highest weekly submission figures of the year to date taking place. The increase of roughly 20% above the average experienced across the rest of the year is certainly noteworthy and may play a role in changing the status quo in 2017 depending on at what level the Small-scale Technology Percentage (STP) is set. The last non-binding estimate of the 2017 STP was 9.02% or 15.96m STCs, down from the 2016 target of 16.95m.
Marco Stella is Senior Broker, Environmental Markets at TFS Green Australia. The TFS Green Australia team provides project and transactional environmental market brokerage and data services across all domestic and international renewable energy, energy efficiency and carbon markets.


