Large-scale Generation Certificate (LGCs)
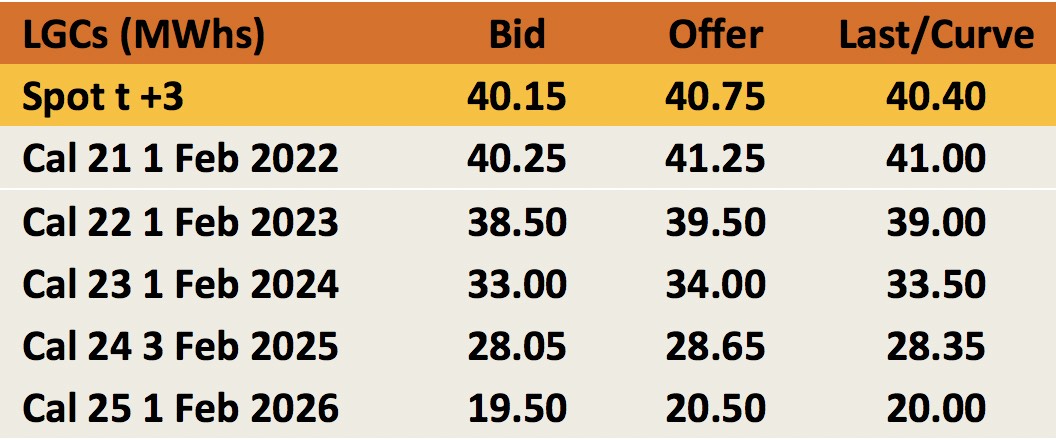
Across most of 2021 a consistent pattern in the LGC market emerged: A flattening of the forward curve profile as the value of later vintages climbed, while the spot/Cal 21 contracts remained flat. In recent weeks however, the front end of the curve has jumped, leading some to wonder whether 2021 may more closely reflect the price movements seen across 2019 and 2020, after all.
Unpacking the mechanics of the LGC curve involves looking at the market in two parts; spot/current compliance year forward (Cal 21) and then the longer dated forwards. Starting with the spot, 2021 has been the third consecutive year in which the LGC supply/demand equation was confronted with a potential bottleneck.
Prior to 2019 a large, pre-existing surplus of LGCs had more than compensated for any lack of LGC creation resulting from years of under investment in new projects.
The last 3 years, however, have seen the coincidence of the erosion of the last of that pre-existing surplus, with very large volumes of LGCs from new projects coming online, though often not as quickly as was expected.
In each of the last 3 years a modest, yet sufficiently larger surplus (generally in the 10m region) had been forecast at the beginning of the year, only to have that forecast steadily downgraded as the year went by, as project delays and curtailments hit LGC production to the point that the final outcome looked set to be a close-to- balanced market.
Yet in 2019 and 2020 the pursuit of the shortfall strategy (i.e. liable parties paying the penalty in the current year instead of surrendering LGCs, in order to purchase the same amount in a later year at a lower price, to then acquit them and obtain a refund) ensured there were sufficient LGCs to meet each year’s obligation. Spot prices in each of those years varied considerably, though in the 2020 the range was tighter.
Until recently, it appeared that despite a similar impact to the 2021 forecast LGC surplus, the spot and Cal 21 markets had failed to respond, sitting in an even tighter range in the $33-$36 region across most of this year.
It seemed that perhaps the market had seen how each of the previous two years had played out and assumed that the ultimate result would be the same again this year.
Indeed, when one of the major retailers announced in an earning’s report in August that it would be pursuing the shortfall strategy to the tune of 3.1m LGCs – its largest shortfall to date – it appeared that the market’s hunch was correct.
Yet in the period since that time, things have changed. The spot and Cal 21 markets broke their range and climbed above the $40 mark for the first time this compliance year, in a sharp rally that appeared to catch many unawares. The effect in the short term is that question of just how tight 2021 will be is now beginning to garner more attention.
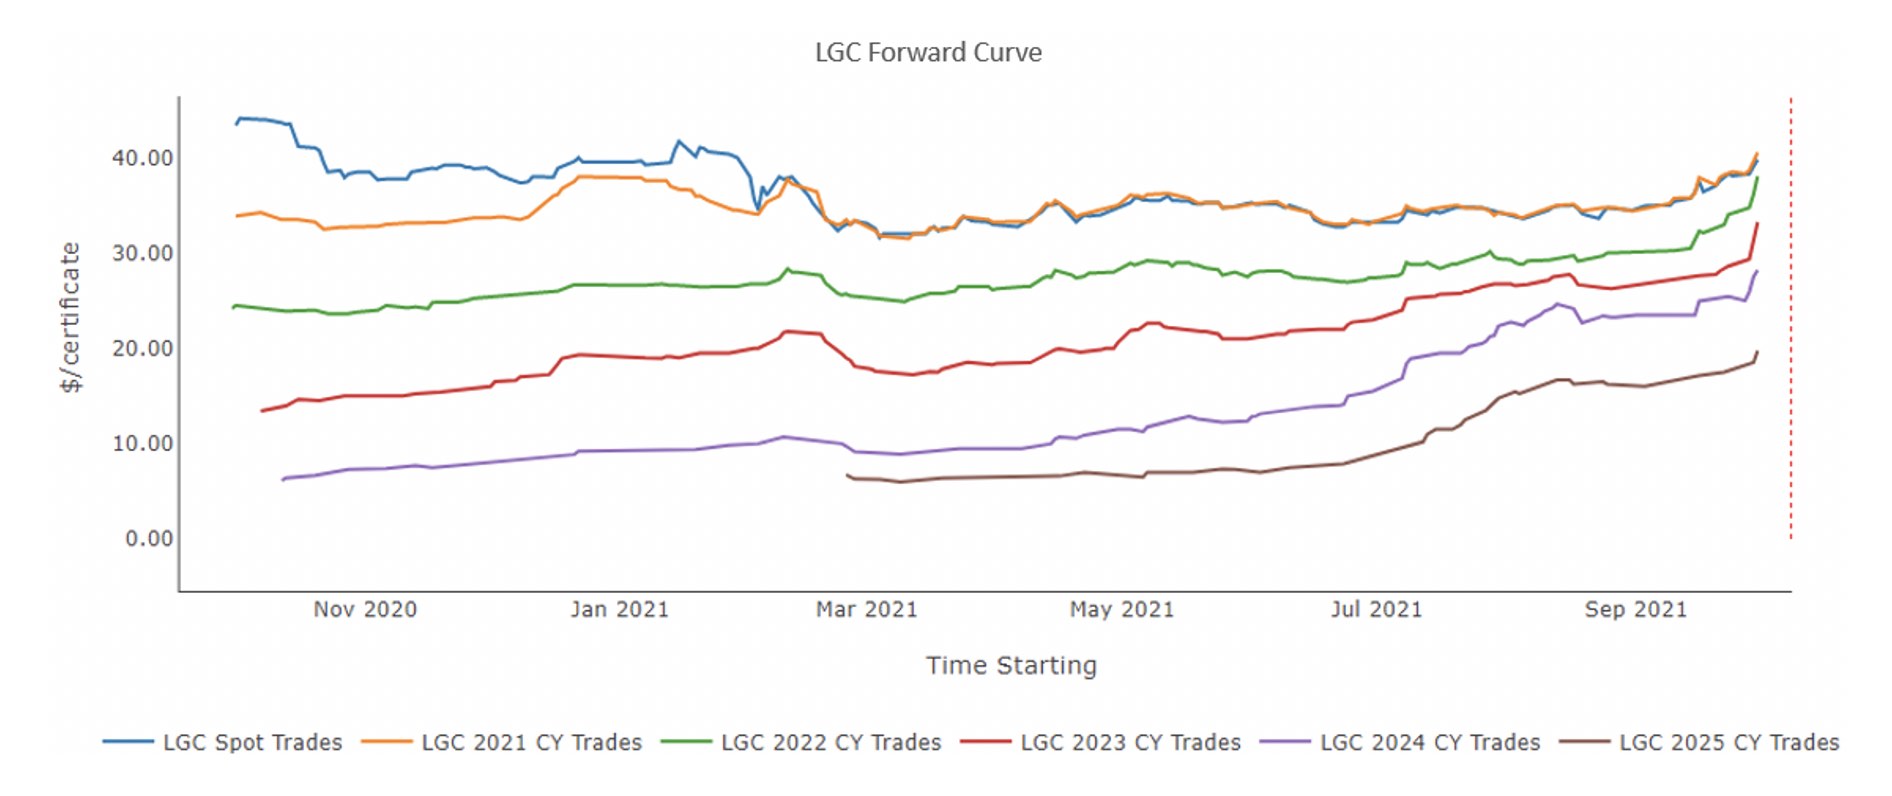
The second part of this story involves the later dated LGC contracts, namely the Cal 22-25s, which have seen a sizeable increase in pricing across 2021. With the scheme’s target having peaked in 2020 and a plentiful supply of new projects continuing to flow, the LGC surplus in future years is predicted to burgeon to eye watering levels, with analysts Green Energy Markets estimating (conservatively, using only existing and committed projects) a 60m surplus LGCs being left over after the Cal 25 compliance year.
How then has, for example, the Cal 24 price tripled (from $9 to above $28) across this year? In part it may reflect demand from anyone who is intent on undertaking a shortfall strategy in 2021, but who had not yet hedged the full amount they would require in Cal 24.
Yet almost certainly there is also a contribution being made by the growth in voluntary demand for LGCs, as organisations seek to take matters into their own hands and voluntarily meet climate change benchmarks in the absence of more ambitious targets from the Australian government. And herein lies the pivotal question for the coming years, just how large will this significant trend become?
In 2019 there was a little over 400k LGCs voluntarily surrendered, mostly via the GreenPower scheme. There is little question that companies seeking to achieve RE100 status (which they can do by surrendering LGCs against their total relevant megawatt hour consumption) will drive that number up in the coming years, particularly toward 2025, the date when many have made pledges to be powered by 100% renewable energy.
Indeed, the mounting pressure that will emerge from an international climate agreement at COP 26 will likely compound this demand.
Given how strongly the forward curve has performed across this year, one would expect that aggregate voluntary demand would need to consume most of that surplus in the coming years, given that a huge number of additional projects are waiting in the wings, should the demand arise.
There is however also the matter of the inverse relationship between LGC prices and voluntary demand.
At a $10 LGC price, customers pay an extra 1 cent per kilowatt hour on their bills, a modest impost to be considered for 100% renewables when they might be paying 25c/KWh. But as that price climbs to $20 or $30, that import becomes 2-3 cents and a more considerable outlay.
Whatever may later occur, the LGC market is certainly alive and well at present and there is yet hope that the growth in voluntary demand may prove a sufficient source of demand to underpin the thousands of megawatts of potential projects that are looking to come to fruition.
The next thing we have to do is fix the challenges that more solar energy presents to the physical market.
Small-scale Technology Certificates (STCs)

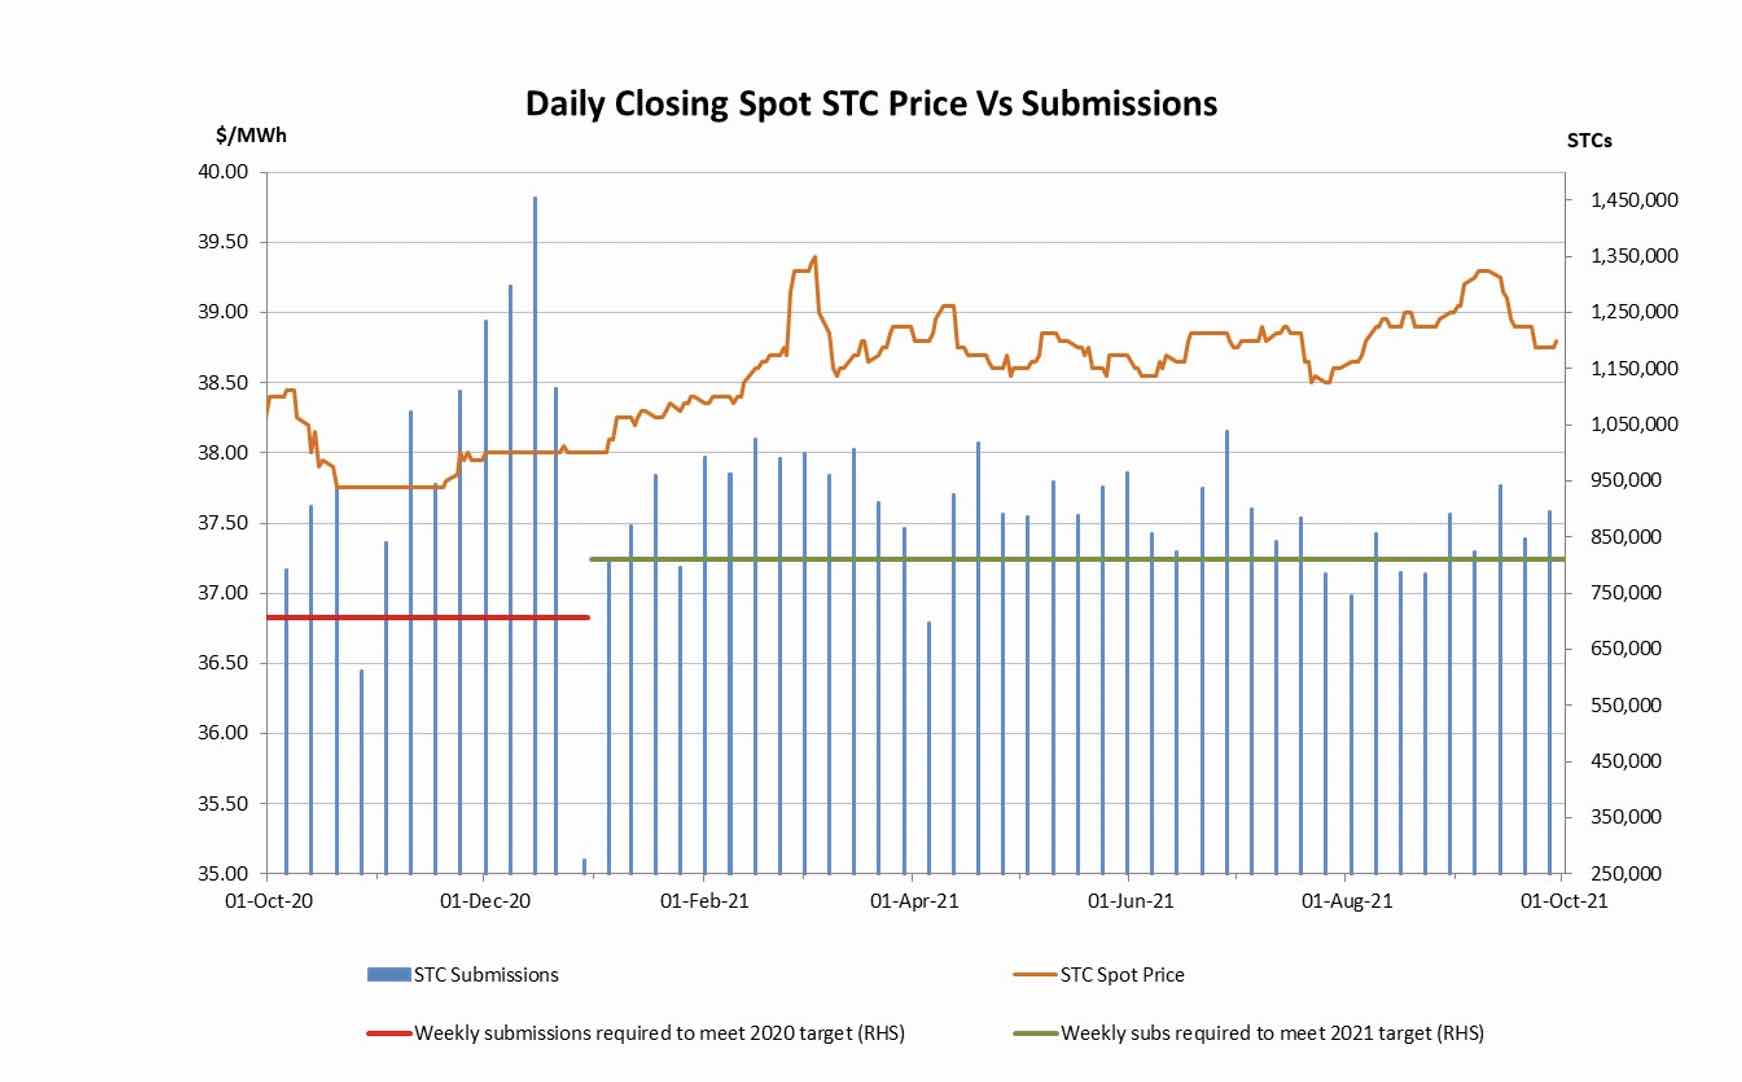
Lockdowns in the nation’s two most populous states impacted STC submissions from late July, driving up STC prices which peaked in the first half of September. A rebound in activity has since been observed but the overall surplus that is likely to be generated in the 2021 compliance year has clearly been impacted. Meanwhile the determination of the 2022 Small-scale Technology Percentage (STP) has some extra complexity this time around, with the pandemic and potential supply chain issues muddying the waters.
Across 2021, the STC market enjoyed a fairly narrow trading band, with the spot generally trading within the $38.50-$39.00 bound. Despite the pandemic causing some interruptions, a healthy surplus of STCs had built up across the first half of the year, with weekly submissions regularly exceeding the circa 810k required by the 2021 STP.
With the mid-winter COVID outbreaks in NSW and Victoria however, came lockdowns in the nation’s two most populous cities and with it a significant reduction in weekly STC submissions as installation activity was halted. As can be seen in the chart below, the effects of this were reflected in the spot price across September, which climbed to a high of $39.30 along the way.
Despite this major impediment to installations, there were still only four weeks in which weekly submissions were below the target rate and September then saw that figure rebound, which allowed the spot market to ease back to $38.75.
Turning to the 2022 STP and there are several major factors are at play. Firstly, as mentioned above, whilst likely to be smaller than previously expected (owing to the extended lockdowns in Sydney and Melbourne), a healthy surplus of circa 9m STCs will likely be rolled over into 2022 and will need to be added to the target.
The reduction of one year in the deeming period, however, which ends with the scheme after the 2030 compliance year, will yield a material reduction in STCs per install, meaning the same number of installs completed in 2022 will result in over 12% less STCs being created when compared to this year.
And then we get to the tricky part for the consultants trying to forecast next year’s STP; how many installs will actually take place?
At the start of the pandemic, it was believed that the economic shock of lockdowns would result in consumers tightening purse strings and putting off investment in solar PV.
With a dramatic increase in people working from home and a trend toward home improvement, the opposite happened, with installs spiking, as rational decisions about offsetting daytime power consumption were made.
So what happens next year when vaccination rates will hopefully yield a return to the office for many and a sharp increase in the opportunity to spend money on outings, events and importantly, holidays?
Another major factor, given the sector’s reliance on China for the manufacture of panels, inverters and almost all its components, is the potential for an increase is supply chain issues across the coming 6-12 months.
When COVID first hit, many industries experienced supply chain disruptions as lockdowns across mainland China extended (by weeks) the return of industries after the Chinese New Year break.
More recently the complexity of the international shipping system has revealed major issues in a pandemic impacted world, with overall freight costs frequently being 2-5 times higher than pre-pandemic levels.
Now the problem has shifted to the shortcomings in China’s electricity ‘markets’ where prices do not reflect supply/demand realities and geopolitical considerations often trump domestic economic interests. With many of the most important manufacturing provinces having exceeded quotas for energy consumption, restrictions in operating hours have reportedly been ordered, which will see the production capacity reduced by a third in some places and more in others.
Many industries are already bracing for the impact on output and there’s no reason to believe that solar PV will escape potential shortages, with downstream effects on installations a potential corollary.
With these matters at play, it may very well be that 2022 is the first year in the last 5 in which installation activity does not increase. If the consultants give these matters credence, it could also be the first time in a while in which the STP shrinks.
Marco Stella is Senior Broker, Environmental Markets at TFS Green Australia. The TFS Green Australia team provides project and transactional environmental market brokerage and data services across all domestic and international renewable energy, energy efficiency and carbon markets.