The US National Renewable Energy Lab is well known and respected for the work it produces, mainly on renewable energy. It has now produced its third annual edition of its generation technology and cost performance. The work can be found at NREL: Annual technology baseline
A review of the work demonstrates that the Levelised Cost of Energy [LCOE] varies widely depending on the assumptions made. Specifically for wind much depends on the capacity factor. So much so that NREL has about ten different estimates for onshore wind.
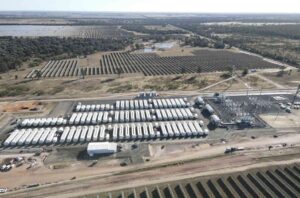
Some other technologies – such as concentrating solar plant [CSP] (ie the Port Augusta proposed 135MW at A$650m) have so few working examples round the world that the capital cost data is unreliable.
For instance, for CSP estimates provided by NREL are based on a 2015 technology study. Clearly, SolarReserve has significantly lower capital costs than those estimated by NREL.
Rooftop PV in the USA is a less efficient industry than in Australia and we manage lower installation costs. On the other hand gas costs in the USA are much lower than in Australia at present.
All data are presented without any subsidy allowances.
Finally, and perhaps most importantly, cost is not the only driver of value. The expected value of any investment is the difference between the net present value of the forecast cash inflows and the net present value of the forecast cash outflows.
The LCOE calculates the price the investment needs to recover if it is to earn its cost of capital. But if one generator is a price taker and another generator is a price setter then the price setter may have a higher NPV even if it has a higher cost than the price taker.
In Australia right now a gas plant is typically more valuable than a wind plant because much of the time gas can set the price whereas in the spot market wind takes the price it can get. Of course this is obvious to most people but nevertheless the point needs to be remade.
For instance, new wind at say Stockyard Hill in Victoria has a total cost less than $55/MWh based on the purchase power agreement [PPA] with Origin energy.
That is less than the fuel cost of running a combined cycle gas plant. But the gas plant can probably earn over $100 MWh in Victoria. In fact, for the 5 months since Hazelwood closed, wind’s average pool price in Victoria is around $63/MWh and gas $117/MWh – a $53/MWh advantage to gas.
Back to LCOE, where we note that NREL has used a WACC (sighted average cost of capital) of 5.4% nominal for all the technologies.
In reality some technologies are riskier than others and deserve a higher WACC. Risk is around both technology, future regulation (eg carbon cost) and also fuel cost.
Even capex, though, for big projects has much more risk than for small, nimble projects. EG: a utility PV farm can be built in a year, a nuclear plant takes say 4-10 years and – guess what – things can change even in four years.
Anyhow, we have taken a snapshot of some of the key numbers and put them into a table. We have taken projects with capacity factors that we think are relatively close to the Australia experience except for wind we have been optimistic and assumed new projects will achieve a 42% capacity factor.


David Leitch is principal of ITK. He was formerly a Utility Analyst for leading investment banks over the past 30 years. The views expressed are his own. Please note our new section, Energy Markets, which will include analysis from Leitch on the energy markets and broader energy issues. And also note our live generation widget, and the APVI solar contribution.