Western Australia’s main grid distributes as much electricity as the South Australian and Tasmanian grids combined. It currently uses 75 per cent fossil fuel energy and contributes 10 million tonnes per year to Australian’s Co2 emissions.
This is the third of my series of articles on WA’s Whole of System Plan (WoSP) for electricity to 2040. You can find the others here and here. In this article, we will compare fossil fuel use and emissions under two WoSP scenarios compared to a cost- optimised transition to 85% renewable energy (RE) by 2030 and 100% RE by 2040.
The WoSP as it now stands can be summarized as ‘keep the incumbent fossil fuelled steam thermal generators going until 2040 and we have no plans to phase them out after that’.
It is a plan written largely for the gas and coal generators not for the community. Recent polls show that more than 80 per cent of respondents want policy makers to focus on clean energy sources.
While the Liberals’ election promise to close all coal by 2025 is over-optimistic, this could be achieved by 2030 providing that planning of a southern HV transmission line and 14,000 MWh of storage, together with installation of an existing ‘pipeline’ of up to 3200 MW of wind projects begins immediately.
I will focus on three parameters – gas use, coal use and CO2 emissions, illustrated by the three graphs in Figures 1, 3 and 4 – for three scenarios:
- A transition to 85% renewable energy by 2030, with 14,000 MWh of storage and then 100% RE by 2040. (dark pink line)
- The WoSP base case scenario – 61% RE by 2040 (blue lines)
- WoSP ‘Techtopia’ scenario – 62% RE by 2040 (orange lines)
Another bar graph (Figure 2) breaks down gas consumption and shows assumed electricity demand growth.
The graphs are from my modelling using open source software – PowerBalance2 and SIREN. All graphs have been ‘smoothed’ using the Excel trend line polynomial function.
Gas use
While the NEM can rely on interconnectors to large hydro and coal generators during its transition to RE, WA’s main grid, knows as the SWIS (South West Interconnected System) does not have either of these.
It does, however, have the Dampier to Bunbury gas pipeline (DBGP) and gas will be essential to a stable transition in WA. Increasing peaks of gas use will become an issue, but the WoSP document does not discuss it.
Under the WoSP scenarios annual gas use either remains the same for the demand adjusted case (solid blue and orange lines) or increases (dashed lines, WoSP demand increase assumptions of 166% for ‘base case’ and 250% for ‘Techtopia’ by 2040).
This means that the McGowan Government currently sees gas as the ‘fuel for an extended transition’.
High gas use ends at a ‘cliff’ in 2040. Although it does rule out any new coal the WoSP doesn’t tell us whether the transition after 2040 will be to more gas, nuclear, renewable energy or a combination of these.
But given that as demand doubles (orange line) so does gas use, the indication is that they intend to continue using more gas.
Figure1. Gas used (TJ) on the SWIS for three transition scenarios.
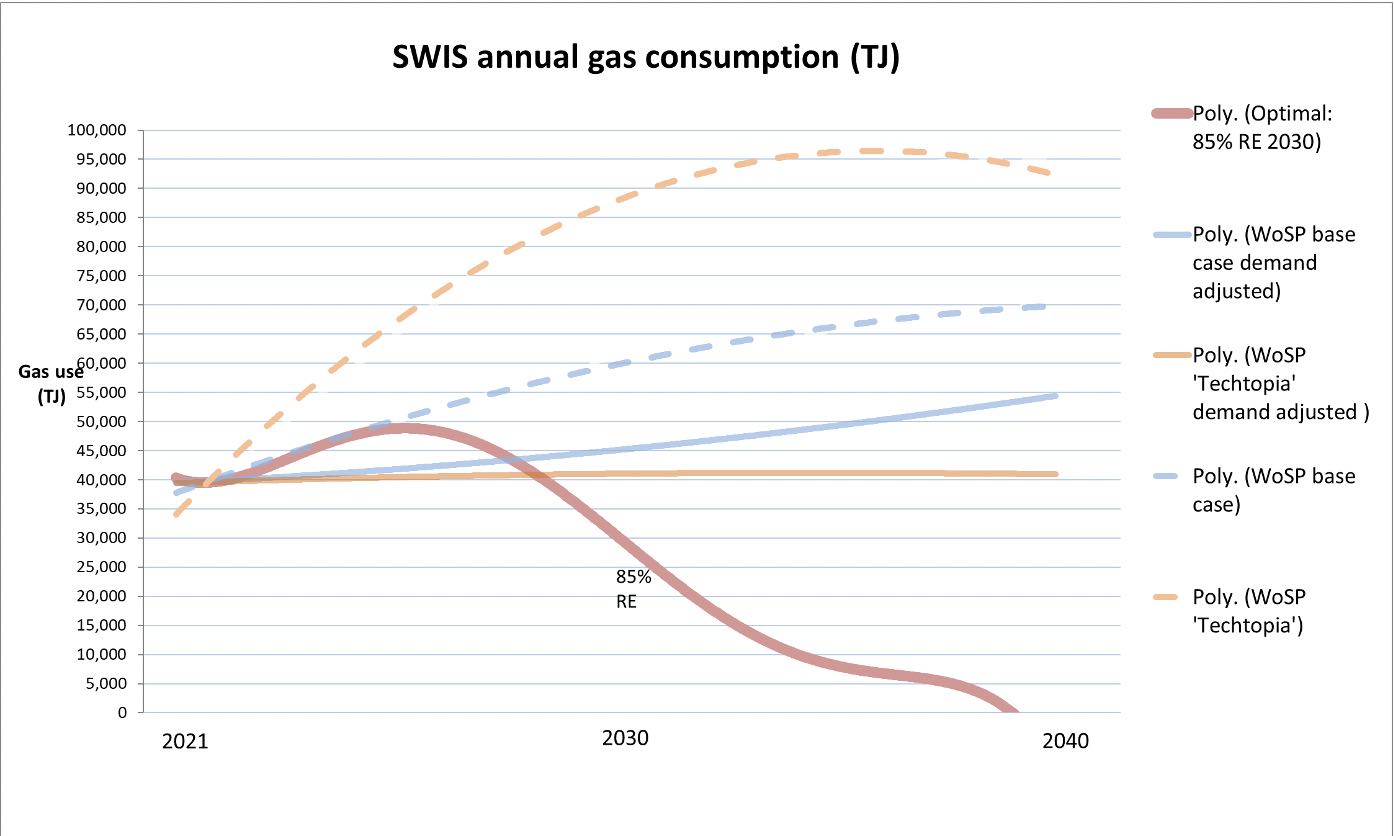
The cost-optimized 85% by 2030 rapid transition (dark pink line in Figure 1) sees gas use at 45-50,000 TJ between 45% and 70% RE then reducing to 28,000 TJ at 85% RE and zero at 100% RE before 2040.
My modelling also shows that steam thermal ramping requirements in excess of 30% installed power per hour increase from the current zero to 90 times per year at 50% RE and 165 at 65% RE. It reduces to zero when all steam thermal is closed at 85% RE.
A major rationale for the rapid transition is to move quickly past the 40- 75% RE ‘ramping danger zone’ by a rapid roll out of wind with closure of ST units as soon as enough wind and utility solar comes on line.
In stark contrast the WoSP, while acknowledging ramping problems (p66), leaves the system in this danger zone for over 10 years.
To minimize ramping the steam thermal generators would have to pay wind and solar not to generate for 8-10% of time during this period. In other words, the choice is either running the ST units inefficiently and wastefully or shutting them down frequently, posing risks to either energy costs or system stability.
Figure 2 below illustrates how in a cost-optimized rapid transition to 100% RE, gas use would change from mostly steam thermal (combined cycle gas turbines) to increasing use of open cycle gas turbines (OCGT’s) then finally all fast-start aero-derivative OCGT’s. By 85% RE, gas use is almost halved even though demand is modelled at 14% higher than current.
Figure2. Details of gas use on the SWIS during a cost-optimized transition to 100% RE.
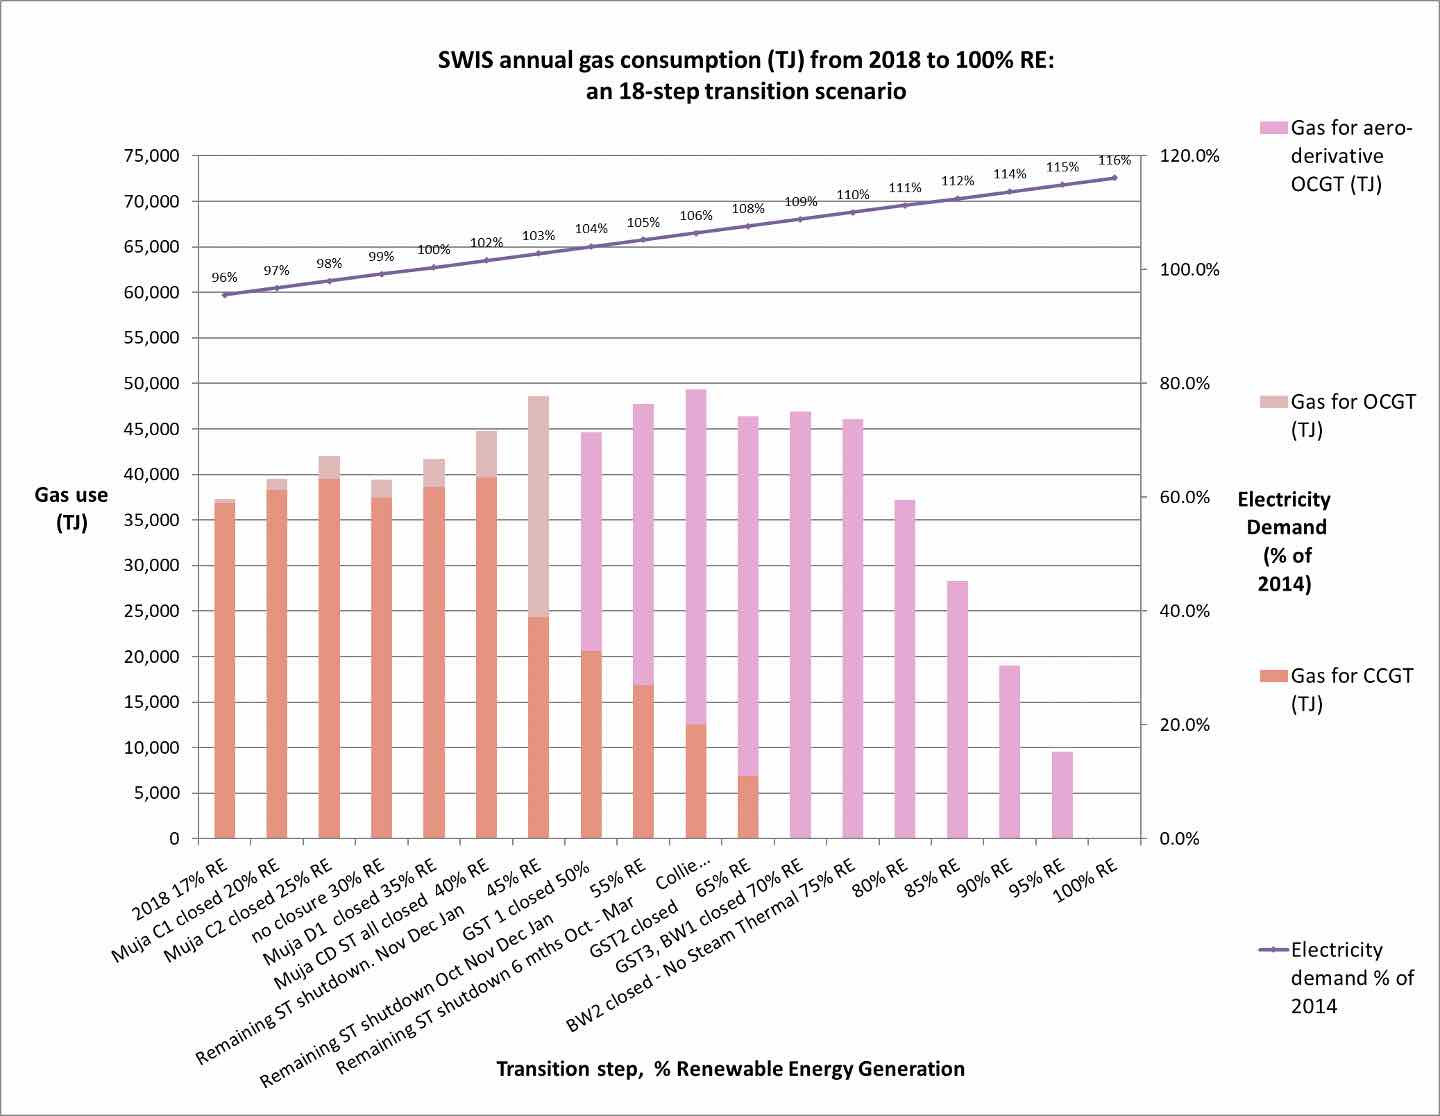
Although annual gas use increases by 30% during the transition, peak gas use (TJ/ hour) increases by much more, as coal generation is closed down and variable RE is increased.
The ability of the Dampier – Bunbury natural gas pipeline (DBNGP) to supply enough gas during these brief periods (usually winter nights) will become an issue, which the WoSP plan fails to address.
Maximum SWIS hourly demand is modelled to increase by 93% from 13 TJ in 2018 to 25 TJ per hour at 65% – 95% RE. This is still less than the average contracted DBNGP capacity of 31 TJ/ hour (750 TJ/day). Hourly gas use exceeds 13 TJ/ hr for about 1200 hours per year and never for more than 17 hours at a time.
Synergy has long-term contracts with the 15 PJ capacity Mondarra gas storage facility at Dongara, which can supply 150 TJ/day (6.5 TJ/h) via the Parmelia pipeline.
New contracts with DBPL and its customers may be needed to supply peak gas flows for the OCGT’s. Storage of diesel fuel to operate some turbines during these periods is an additional option that may need to be installed.
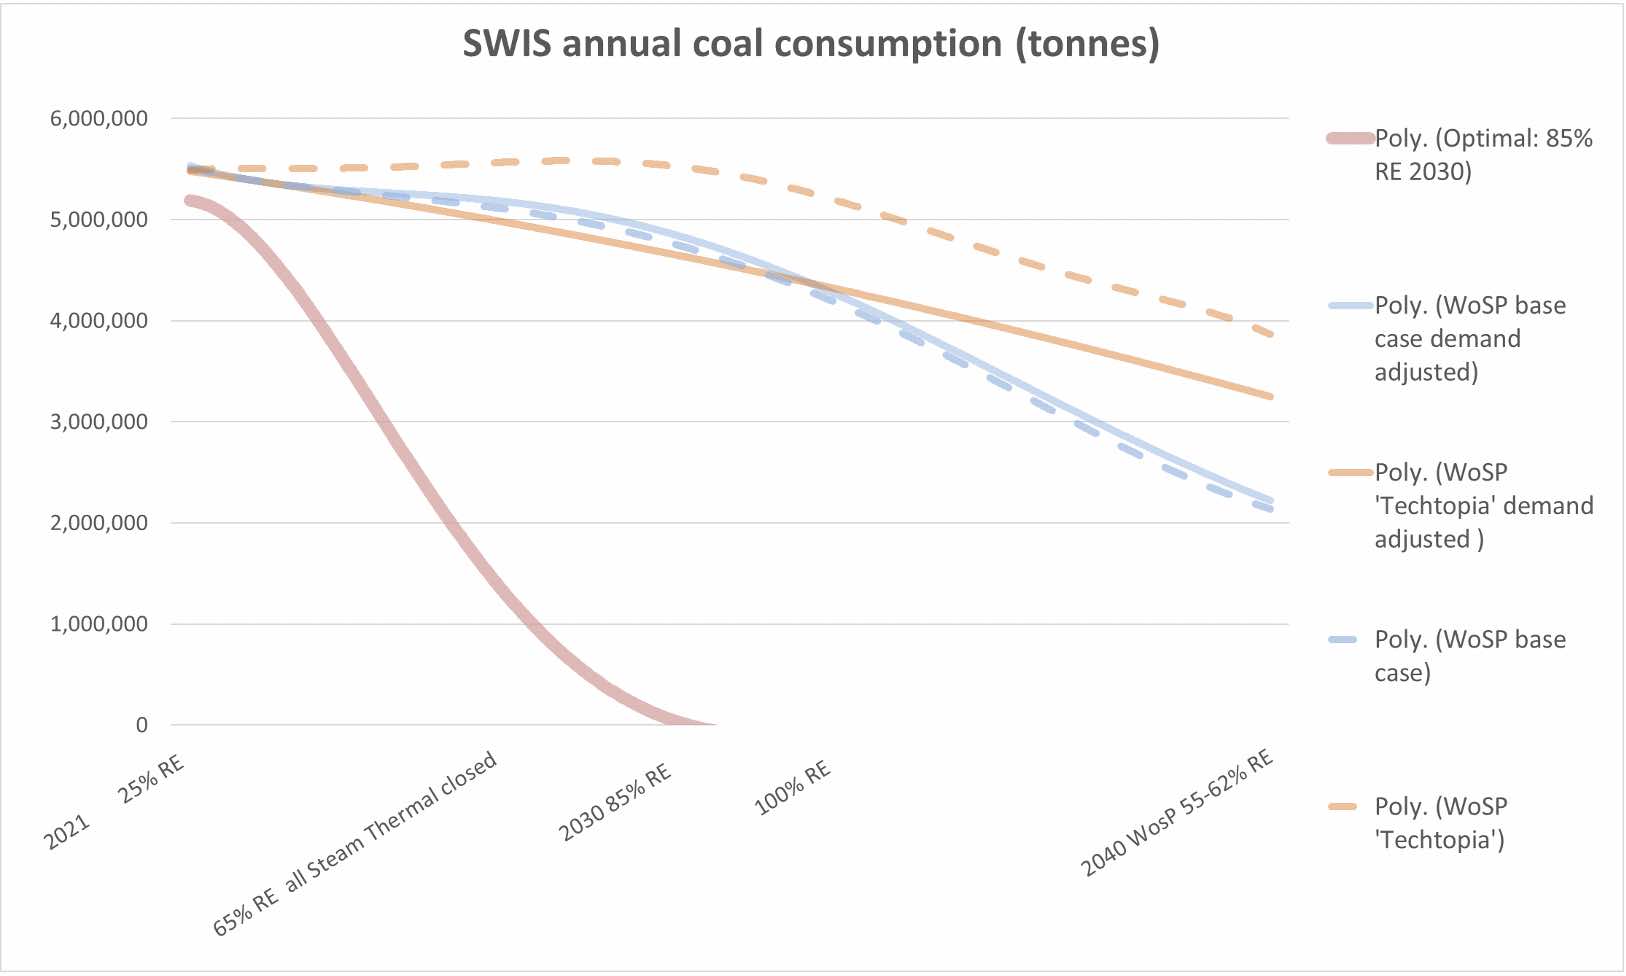
Coal use
While the optimal 85% RE scenario sees coal consumption reducing from the current 5.5 million tonnes per year to zero before 2030, the WoSP scenarios see coal consumption of 2.2 – 3.8 million tonnes in 2040.
The Blue Waters and in some scenarios Collie units will still be operating, in spite of the fact that they will be 30 and 40 years old respectively.
The state government owns the Collie and Muja power stations and can easily close both of them by 2030. Blue Waters has already been written off by its owners.
Coal power could easily be replaced by large batteries. The Collie – Perth 330 kV transmission lines could be utilized by wind and storage energy fed in via spur and extended lines.
The argument that steam thermal ‘base load’ is needed for frequency stability and reactive power is spurious as these can be provided by a combination of batteries and using some old gas and coal generators as ‘synchronous condensers’.
Figure 3. Coal used (tonnes) on the SWIS for three transition scenarios.
CO2 Emissions
From the Figure 5 below it can be seen that the WoSP scenarios reduce emissions moderately and linearly to 2040. The ‘85% RE cost-optimized’ transition achieves 1/5th of the WoSP scenario emission by 2030 and zero emissions by 2040.
Figure 4. CO2 emissions from WoSP and ‘85% RE cost optimized’ scenarios

It is evident that the WA Government has not fully considered the carbon impacts of its electricity plan. They have admitted this in confining their criteria to ‘lowest cost’ (although they have failed to demonstrate that their scenarios are in fact lowest cost).
The WoSP keeps coal and large amounts of gas electricity generation through to 2040, resulting in a carbon intensity of more than 0.25 tCO2e/ MWh, when it could be less than 0.08 tCO2e for no more cost.
By adopting the ‘85% RE by 2030’ trajectory, Government would save 120 million tonnes of CO2 emissions by 2040 and many millions of tonnes after that.
WA is the most affluent and highest per capita carbon emitting state in the world. We are also one of the most vulnerable to climate impacts. Our failure to reduce our emissions will be multiplied by those more populous and less affluent countries who will not reduce their emissions because Australia refuses to.
A clean electricity grid is a ‘no net cost’ means of enabling clean transport and ‘clean green’ production.
Australia’s failure to take significant action to reduce its emissions has meant that Europe and the US are already planning to tax the carbon embodied in the products we export to them. Unless we start a rapid transition to clean electricity more countries will follow suit.
See also: How the WA Libs shook off climate denialism to trump Labor on clean energy
And: WA’s “go slow” and “go fast” energy transition plans need proper modelling