Live energy data goes national – an Australian first

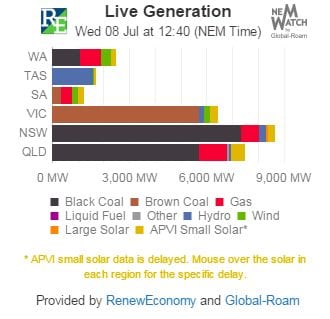
The popular live energy generation widget provided as a joint initiative between RenewEconomy and Global Roam’s NEM-Watch is going national – with the addition of data from Western Australia’s own grid.

The addition of data from WA’s South West Interconnected System will give a truly national picture now that it is added to data from the National Electricity Market, which covers the eastern and southern states. Only remote grids in WA (the Pilbara and north west), Northern Territory and Queensland (Mt Isa) are not included.

The live generation widget has been a popular addition to the RenewEconomy web-site since early 2015, and has attracted some warm compliments.

Three of the most common suggestions for improvement we have received since the widget first went live revolved around the two main missing data sets:

1)  In the first days of the widget, we were asked (by many) to expand the picture by providing a view of the live output of small-scale solar PV on (mainly) residential rooftops across the country.

We delivered on this need in late March 2015 with the inclusion of live solar data (sourced from the APVI’s solar map) at the same time as we released an upgrade to the broader NEM-Watch application.

2)  We’ve also continued to be asked to include a view of what’s happening in Western Australia.

“We’re pleased to note that we’ve also been able to do this, with the launch of the next upgrade to the RenewEconomy widget in July 2015,” says Global Roam’s Paul McArdle.

Here’s how it looks now. Click here for more details.

WA widget update

3)  Finally, we’ve been asked by a number of people if they can also include this widget on their own website.

This is also now possible – mouse over the widget on the RenewEconomy site to access instructions for how you can do this.

“We appreciate the opportunity to work with RenewEconomy in providing this service, and look forward to continuing to receive suggestions for how we can continue to enhance this service,” McArdle says. And RenewEconomy would like to add its appreciation to the work that Paul and his team have done.


Comments

8 responses to “Live energy data goes national – an Australian first”

  1. Paul McArdle Avatar

    Likewise, Giles, we appreciate the opportunity to work with RenewEconomy to help your readers see a clear picture of the current mix of generation.

    1. Jacob Avatar
      Jacob

      What the hell is NEM time? Just use GMT.

  2. JeffJL Avatar
    JeffJL

    Thank you RE.

    I go there and find out that here in WA we are producing more wind power than SA. 340 to 124. I suspect that this will not occur too often.

  3. Kym Avatar
    Kym

    Thanks Giles.

    It would also be interesting to see how much power is passing through the interconnection between the states. Ie if SA is importing power from Victoria, the generation would be on the Victorian bar but you could display the imported power on the SA bar in another colour but you wouldn’t be able to identify the generation source.

    1. Paul McArdle Avatar

      Thanks Kym

      You’ve pointed out one interesting additional data set (inter-regional transfers) and there are many others as well – spot prices and regional demand being 2 other obvious ones (+ weather data, available capacity, hydro water levels, etc…).

      Add together all of these data sets and pretty soon the widget would take up the whole screen – which, indeed it does in the full NEM-Watch application, which is illustrated in the snapshot (attached) and explained further online here:
      http://www.NEM-Watch.info

      Feel free to run your own trial to have a look.

      Paul

    2. Smurf1976 Avatar
      Smurf1976

      As of right now:

      SA is exporting 177 MW (to Vic).

      Tas is exporting 103 MW (to Vic).

      Vic is importing 173 MW net (from SA and Tas) but physically is exporting some to NSW.

      Qld is exporting 113 MW (to NSW).

      NSW is importing 225 MW (from Vic and Qld).

      Most of the time, Vic and Qld generate more than they use whilst NSW almost always produces less than it uses. For SA and Tas it varies with flows in either direction fairly common.

  4. greenjenny Avatar
    greenjenny

    Hooray WA has become part of Australia! Great work Giles and team.

  5. Ray Miller Avatar
    Ray Miller

    Thanks Giles, appreciate being able to get a “live” picture of the Australian “traded” electrical energy by sources, a further step to the democratisation of “our” energy system. It’s a pity AEMO has not seen fit to give everyone the same picture. It then reveals the true push against the unstoppable renewables and the location of the worst emitters. Cheers

Get up to 3 quotes from pre-vetted solar (and battery) installers.