In just a few months we’ll be one full year into the tenure of the new federal Labor government. The general feeling about Australia’s climate policies and philosophy from around the world is that the ‘adults are back in charge’ – the bumbling, delaying, denialist, coal-waving dinosaurs of the Coalition government are history.
Due to the long lag in emissions data, it will still be quite some time until we get a good picture of how climate-causing pollution actually changes under eventually implemented policies of the government. Possibly not even until just before the next election. What we can do now is get: (a) a good, evidence-based feel for how big the task is, and (b) at least a vague idea of whether existing policy is up to that task.
The Australian government environment department’s annual projections report has served as a rough approximation of the ongoing impact (or lack of impact) of climate policy in Australia.
Previous reports I’ve covered here at RenewEconomy show a litany of accounting tricks being used to exaggerate future emissions reductions, alongside the gradual correction of over-estimation of coal and gas and under-estimation of wind and solar.
Labor’s first projections report breaks some of those narratives. It reveals that the previous government may in fact have been recently over-egging renewable projections as a way of distracting from their own failure to accelerate renewable growth. Ditto for EVs. We already know that huge adjustments to land-use data have been exploited to paint defensive greenwashing narratives by the Coalition. This new report reveals how dire the previous government’s failures were.
But it also shows that Labor need to truly step up if they’re to rescue that state of affairs. Ambition, courage and a fighting spirit are all necessary components of a reversal. It also hints at the possibility that Labor might even be replicating some of the worst habits of the previous government.
It’s a big report, but don’t worry. Let me take you through it. I promise you, it’s very, very interesting.
What the models found
The December 2022 projections report found that, in the baseline scenario, Australia will not achieve its target of a 43% reduction in emissions by the year 2030 (based on 2005 levels) – it’ll be more like 32%. But that does not count the two largest chunks of Labor’s climate policies, which are: (a) major reforms to the safeguard mechanism and, (b) a target of 82% clean power for Australia’s grids.
The DCCEEW says they created a new, additional scenario to model these policies, and found that with them, emissions are projected to be more like 40% by 2030. Which is close-ish to the target of 43% (more on that whole thing later).
Policies like the “National Electric Vehicle Strategy” and the “National Reconstruction Fund” were not included in either scenario, but presumably will be in December this year. “It is expected that the gap in meeting the 2030 target will close” as they model these additional policies, writes DCCEEW.
The first projections file I found, from 2015, envisaged 724 megatonnes of CO2 equivalent (MTCO2-e) being released in the year 2030. This report predicts 422. Yet, the gap between 2021’s report and this, from 2022, is one of the smallest in the history of the projections. And every projection is still miles away from a 1.5°C aligned target.

The headline figures are unremarkable. Like every report before, it nails down a little nugget of progress, but doesn’t report any deep change in future trajectory. But buried in the data are a collection of really interesting and concerning problems that signal real and significant difficulties for the government, on climate.
Bad news in the transport sector – revised projections and slower EVs
Something that immediately stands out in this report is how the 2022 projections for transport emissions are higher – much higher – than those produced in the years 2021 and 2020. Covid knocked them all well down below the previous reports, but it’s strange to see a major move ‘backwards’ like this, given no real shifts in transport policy either way (and the new government’s EV policy not being included at all).
![]()
Labor have a very high hill to climb, in the transport sector. One stunning sentence in the report is this finding:
“Light duty vehicle activity is expected to increase in line with population growth. This, alongside a trend towards higher weight passenger cars (such as Sport Utility Vehicles (SUVs)), offsets the effects of fuel economy improvements and technology switching over the next few years, so emissions remain stable in the near term.”
That is another half-decade of not-falling emissions for cars in Australia, thanks to the completely pointless and avoidable trend of ludicrously bigger vehicles being foisted on consumers by greedy fossil car manufacturers.
The key issue within the data for the transport sector is a major revision to the methodology use to figure out the climate impacts of cars. It seems that under Angus Taylor’s leadership, emissions from this sub-sector have been badly underestimated, and the department has taken a hit of revising those emissions upwards – towards a more realistic number – in this report. Hence, the weird effect in the chart above where this year’s projections are far higher than previous years.
DCCEEW commissioned a consultancy, Transport Energy Emissions REsearch (TER), to advise on this, and ended up using emissions intensities somewhere between TER’s advice and the old, 2021 approach (combining TER’s data with the ‘survey of motor vehicle use‘). This could change in the future – it’s clear that the underlying calculations here are messy and the department is being mostly transparent about why this change has occurred.
The 2022 projections report also does some very significant downwards-revisions on EV deployment, thanks to “constraints on short to medium term supply”. For the year 2030, the 2021 report predicted 1.7 million EVs. This new report winds that down to 1 million.

Australia’s upcoming EV strategy, due before the May budget this year, will reveal details of the government’s only transport-related policy.
Chances are it’ll be a package of incentives and perhaps a gentle regulatory push such as a fuel efficiency standard. But if the government avoids any deeper policy changes – such as setting a phase-out date for combustion engine sales, getting people out of cars entirely, reducing the need for freight and air travel, and aggressively supporting active and public transport – these numbers will continue to look bad for the 2023 projections report.
Renewable energy: the reverse hedgehog
Before 2020, renewable energy was badly underestimated in this report, and fossil fuels were badly over-estimated. That has resulted in what I like to call a ‘hedgehog chart‘ – where actuals trend consistently in one direction, but every forecast spikes off expecting the next year to be different, every single year. The famous example is the one of the IEA, by Dutch researcher Auke Hoekstra, showing the IEA consistently under-predicting solar growth.
Post 2020, something significant has changed. Australian renewable energy is generating less than what was previously forecast. That could be because the forecast was too optimistic, because renewables underperformed, or both. This means fossil fuels are generating more than expected, and grid emissions are not as low as expected. Generally: it’s bad.


Actual wind and solar generation in the year 2022 was previously forecast to be nearly 69 gigawatt hours. It ended up being just under 60. 2020’s projections also predicted coal generation of less than 120 gigawatt hours. But it was 125. Both wind and solar ended 2020 being around four gigawatt hours under the peak amount forecasted for 2020 generation.

The latest Clean Energy Council ‘renewable projects’ quarterly report provides at least a partial explanation of this notable shift in the difference between projections and reality. There has been a noticeable slow-down in renewable investment in Australia, in the final stretch of the previous Morrison / Taylor government. If it’s due to shoot back up during the Labor years, it hasn’t yet (an update is due out next month from the CEC).

Wind in particular is being hit hard by a noticeable slowdown both in the growth of new capacity and the generation output of freshly-minted and existing wind farms. A new Wind Europe report shows new wind turbine orders collapsed up here in Europe. That is really, really bad. “Wind power heavyweights..are reeling from high raw material and logistics costs, changes in key clean-power subsidies, years of pressure on turbine prices and an expensive arms race to build ever-bigger machines”, wrote Bloomberg.
Renewable energy is forecast by the DCCEEW to be 70% of Australian electricity in 2030, rather than the 82% target set by the government. And the underperformance is beginning to become systemic, rather than a covid-related aberration.
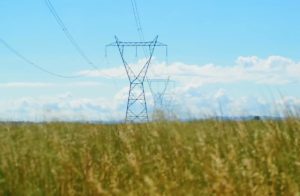
Will the government’s new transmission line policy be enough to bring these numbers back onto the good side? I doubt it – something much more will be needed. They’re not far from the target, but if things continue, they will be.
Leaning on land use (again)
When you look at the difference between the 2022 projections and the 2021 projections, they have ‘improved’ – ie, there is a forecast of fewer emissions into the future. Break the difference between the two years into their components, and most of the reduction comes from the ‘land use’ sector:

This isn’t due to any policy intervention – it’s due to a massive historical revision of LULUCF data to display lower greenhouse gas emissions. For LULUCF, it is in fact the deepest downwards revision of both historical data and future projections since 2015:
This data revision results in a downwards pressure on future emissions, but for everything else, there has actually been a worsening of outcomes compared to the 2021 report. Namely, electricity in the next two years, and transport, fugitive emissions, and agriculture for the rest. Take LULUCF out of the picture, and the net change for each year except 2030 is higher predicted emissions than the 2021 report – that is, the black dotted line is in the positive:

This is a problem for a simple reason: you cannot cram carbon you pulled from deep underground into the thin biosphere on Earth’s surface. There is a natural cycle of carbon as it jumps between vegetation, the atmosphere, and the oceans. The idea behind including land-use and land-use-change emissions is that you can ‘cancel out’ the emissions that come from burning underground fossils by simply placing them into the surface carbon cycle. It’s wrong, and therefore it’s wrong to count LULUCF against fossil carbon emissions.
That’s before we even get to the wild revisions, which indicate LULUCF data is persistently unreliable, and could change massively in any direction in the future (strangely, revisions always seem to be exactly in the favour of the government of the day….).
By including LULUCF against the emissions unlocked from underground, a badly misleading picture is being painted. Add onto that the incredible uncertainty underpinning the measurements of LULUCF, which opens up the door for massive historical revisions that change entire climate narratives.
The worse transport emissions, over-forecast renewable energy growth and this over-reliance on land-sector emissions.
What do Labor’s policies really do to emissions?
In 2020, I first collated the historical emissions projections reports for RenewEconomy and pointed out that due to an extremely pessimistic view of renewable growth (and an optimistic one for coal), emissions forecasts had once projected massive rises, but were inching downwards each year as the government acknowledged reality.
Despite these renewable projections growing closer and closer to reality, in 2020 and 2021, the projections showed the Liberal-National government was predicted to miss its weak 28% by 2030 target. No matter: former PM Scott Morrison and former energy minister Angus Taylor simply insisted they were predicted to hit the target, and that got reported almost universally.
The main trick used in 2021 was the presence of an additional future scenario in the report, in addition to the baseline. This alternative scenario tweaks the assumptions and input data to assume high technological growth – cheap renewables, lower fossil fuel exports and faster new technology development.
In 2020 and 2021, the Morrison government brazenly pretended that this scenario represented their ‘technology roadmap’ policy, despite the 2019 report (which predated their policy) including a scenario with identical assumptions. I tested this by comparing the percentage difference between the ‘baseline’ and ‘alternative’ scenarios for each year. They were all the same. It was a copy/paste job, presented as an analysis of policy, and it got swallowed whole by an uncritical media unwilling to interrogate the numbers.
In this most recent Labor report, there is no more ‘high tech’ sensitivity. That has been replaced with an “additional measures” scenario; one which purports to partially model Labor’s policies of both the 82% renewable energy target and the still-being-designed Safeguard Mechanism.

It’s declared in Australia’s official submission to the United Nations (just as the Morrison government’s ‘tech roadmap’ model was last year). And as with the Morrison government, it’s the ‘alternative scenario’ result that got centre stage in media coverage. Ask someone who read the coverage what they think Australia is on track for, and chances are they’ll say 40 or 41% reductions.
Here’s something weird, though.
When I determined Morrison’s ‘tech roadmap’ model was just a re-badged tweaking of inputs rather than real policy modelling, I did that by comparing percentage differences between the baseline and the ‘alternative’ scenario.
Do that for this year, and you can see that the percentage differences are almost exactly the same as the ‘high tech’ sensitivity from last year.

If a completely different policy set was being modelled here, from the ground up, you would expect significant variations between years. Falling grid, industrial and mining emissions from enforced government policies should do very different things to baseline projections than the hand-wavy good-luck assumptions of the high-tech sensitivity analyses of previous years.
Generously, this is a very weird coincidence. It could just be a few corners being cut in some hasty modelling. It could just be some quirk of their model that these percentages end up the same. But it could also be that in a hasty effort to present a higher emissions reductions number to the world, the Labor government copied one of the worst, most deceptive habits of the Coalition government.
Nothing in this report imparts particularly good news for the Labor government. They inherited an indescribable mess from the prior government. Renewable energy investment was slowing down, transport sector data was a mess, and there is a massive pipeline of new coal and gas projects that Labor is far too nervous to reject or reduce.
What we can say, with some confidence, is that the current policy suite is simply not up to the task. Not the task of achieving the stated target; nor the greater task of accelerating ambition much closer towards a 1.5°C aligned target.
There are simply far too many planned fossil fuel extraction sites in the pipeline, which will push strongly against rapid reductions in power, and slow reductions in transport. This projections report, for instance, assumes that all of the worst, most polluting extraction projects go ahead, such as Scarborough. The Safeguard mechanism’s reliance on offsets could result in even greater emissions.
There is a pathway out of this quagmire. The Climate Council, for instance, just published a big list of near-term recommendations that would, at least, get Australia on track to a much deeper cut by 2030. They’re all incredibly uncontroversial and would likely be very warmly welcomed by Australians still dealing with the terrible cost of a fossil fuel price crisis.
There’s really no excuse for inaction, anymore. All the signs are pointing to a mammoth task ahead.