The ISP report has been delayed. It’s not unusual for reports to be delayed but at the same time it’s easy to see that the report will be controversial.
It will have some implications for the electricity price, to the extent it’s a pathfinder for new investment in transmission but more importantly it will be the implied ambition of the report that will cause political ripples.
And when your boat is low in the water and some of the passengers are trying to get their hands on the tiller, ripples can lead to wet and even cold feet.
Still, we have no doubt the report will be released shortly perhaps after everyone has had a chance to craft the accompanying messages.
Similarly, the ACCC report is also likely to lead to some foot stamping and calls for more action.
We state again that essential service or not high prices are a natural and essential part of a well functioning market, just as low prices are.
Market power is one thing, but in ideal markets high prices provide investment, substitution and consumption signals. The rooftop PV industry has had huge benefit firstly from the high prices that come with regulated distribution tariffs and more recently from high pool and future prices.
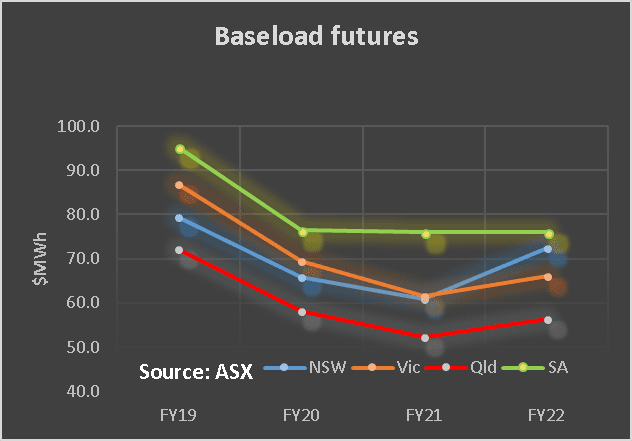
Although the REC scheme has provided underlying impetus to the new investment in wind and Pv which will continue to commission over the next two years it would be stupid to ignore the impact that humble old baseload futures have had on incentivizing some of that investment.
Liberals start the nationalisation trend
Finally I’d point out that once you let the “socialization” or “nationalization” cat out of the bag it’s hard to put it back in. The Federal Govt by taking over Snowy, unilaterally declaring that Snowy 2.0 is an economic investment without calling for tenders, and becoming the 100% owner of the 4thlargest retailer in the land by customer numbers has signalled to all State Governments that the Liberal Party regards it as perfectly acceptable for Governments of any persuasion to own and build electricity assets such as retail and generation that compete with the private sector.
No matter the “hands off” approach any private sector operator will have misgivings about this trend. The Government is the referee and the rule maker. It’s a bit much when it also owns one of the teams running round the paddock. We can see a role for Government as a low-cost provider of capital but also see risks of abuse.
The market action
Wind & PV are now providing a bit over 10% of supply. On a ten-day moving average the figures below show that combining wind and PV does tend to reduce at least seasonal volatility. Wind picks up in Winter as PV output is down and vice versa.


Elsewhere, warmer weather lead to markedly softer consumption than last year and softer pool prices. Gas prices are up but perhaps easing. REC prices are very soft as expected in the out years. Futures were little changed. Cap prices in 2021 softened a touch but it’s really 2022 we are interested in.


Share Prices


Volumes

Base Load Futures, $MWH


REC Prices

Gas Prices


David Leitch is principal of ITK. He was formerly a Utility Analyst for leading investment banks over the past 30 years. The views expressed are his own. Please note our new section, Energy Markets, which will include analysis from Leitch on the energy markets and broader energy issues. And also note our live generation widget, and the APVI solar contribution.


