Know your NEM: Time to roll your own solar as grid prices soar

Figure 11: Baseload futures financial year time weighted average

Summary – time to roll your own

Despite cooler weather, lower volumes and lower prices FY18 futures went up another 4% last week and have now gained 40 per cent in the last 10 weeks.

It remains very unclear which power stations are going to lift output to supply the market next summer. We think there will be genuine difficulties and that producers will try to exploit the situation.

The forthcoming sharp rise in grid delivered prices provides a renewed incentive for distributed generation, so PV installers and battery sellers should be out there doing the rounds.

Turning to the weekly action

  • Volumes : across the NEM volumes in the week to March 3 fell 1% compared to the previous correspond period (PCP), with South Australia and QLD bucking the average. Over the past 30 days NEM wide volumes are now flat on last year as the impact of the really hot weather is averaged down and because Portland aluminium smelter is operating at low levels of capacity. A reduction of 150MW in QLD, when Boyne Island reduces output, will reduce average demand in QLD by about 2.5%. Boyne Island gets 85% of its power from Gladstone power station. RIO Tinto owns 42% of Gladstone  power station and Gladstone operates at significantly less than full capacity. So the question is why RIO didn’t just write a contract for the increased output with Gladstone?
Figure 1 Gladstone Monthly average output v theoretical capacity. Source: NEM Review
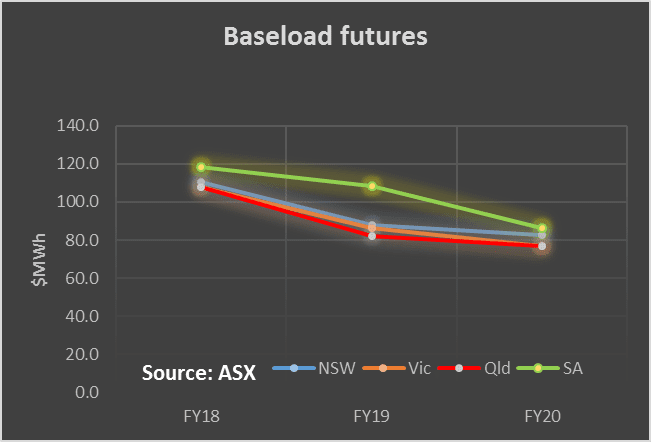
  • Future prices:.. 2018 futures prices rose another 4% in the Eastern States to be around $110 MWh. Although the price in South Australia is still higher at $118 MWh there isn’t that much in it. Never mind the price last year, FY18 futures prices are up 40% since January in the East. There is less action in the outer years but that likely reflects uncertainty. Finally, it’s really “never mind the price” where’s the electricity going to come from. That said there is likely an element of squeeze by the thermal generators. They know that no one can magically create any new competition over the next 12 months so they are making the most of their day in the sun.
Figure 2 FY18 base load futures quarterly average. Source ASX

These prices clearly incentivise new generation particularly in NSW but also Victoria. At the same time the price increases that businesses and households are going to see are going to provide an even better outlook for distributed energy and storage. Roll your own over the next 12 months may be the way to go.  Businesses for instance may see not just energy tariffs but also demand tariffs with big increases as volatility increases.

  • Spot electricity prices. Were relatively low this week other than in South Australia
  • REC Unchanged.
  • Gas prices fell in Brisbane but remain around $11-$12 Gj in Adelaide and Sydney. High gas demand in Sunmer for peak generation also means that building up reserves for the traditional winter heating peak is going to be more of a challenge this year. Winter prices could be higher than ever. We shall see.
  • Utility share prices: Utilities have had a bad run in the sharemarket recently, save for AGL and APA. Orocobre has done particularly poorly. It reported that its lithium brine ponds weren’t working the way they were modelled. Apparently the pond model is 20 Megabytes and it has a bug in it. There’s a surprise. The  brine ponds gradually concentrate the brine via evaporation until its sufficiently concentrated to enter the production plant.  Management say that fixing the problem requires producing less (50% less) over the next six months. This didn’t make shareholders happy.
Figure 3: Summary
Figure 3: Summary

Share Prices

rsz_1picture1
Figure 4 Selected utility share prices


Figure 5: Weekly and monthly share price performance

Volumes

Figure 6: electricity volumes

Base Load Futures

rsz_screen_shot_2017-03-06_at_123930_pm

Figure 11: Baseload futures financial year time weighted average

Gas Prices

Figure 12: STTM gas prices


David Leitch is principal of ITK. He was formerly a Utility Analyst for leading investment banks over the past 30 years. The views expressed are his own. Please note our new section, Energy Markets, which will include analysis from Leitch on the energy markets and broader energy issues. And also note our live generation widget, and the APVI solar contribution.


David Leitch is a regular contributor to Renew Economy and co-host of the weekly Energy Insiders Podcast. He is principal at ITK, specialising in analysis of electricity, gas and decarbonisation drawn from 33 years experience in stockbroking research & analysis for UBS, JPMorgan and predecessor firms.

Comments

8 responses to “Know your NEM: Time to roll your own solar as grid prices soar”

  1. Chris A Avatar
    Chris A

    In answer to your question David, CSEnergy has the dispatch rights for Gladstone Power Station. All the energy above 810MW that Boyne doesn’t use forms part of CS’s portfolio. Like Wivenhoe, its being used as contingency. In the hands of an independent operator it would be coming in as competition. The issues with competition in QLD you have spoken about previously. Its right royal mess.

    1. David leitch Avatar
      David leitch

      Thanks Chris, that’s helpful. Do you know how long the dispatch contract lasts for? There must be revision or renewal terms. Its surprising that RIO’s ownership rights don’t give it some sway. In the alternative it could buy out one of the minority partners. The minority partners themselves must be leaving some money on the table in the current environment.

  2. Mark Diesendorf Avatar
    Mark Diesendorf

    Sorry to be pedantic, but surely it’s time that regular contributors get the terminology/notation correct. If you wish to write $100 per megawatt-hour (MWh), the correct notation is $100/MWh, with the forward slash representing ‘per’. ‘$100 MWh’ doesn’t mean anything.
    Some contributors still need to note the difference between energy, measured in MWh or megajoules (MJ), and power, measured in megawatts (MW), which is the same as megajoules per second (MJ/s). Thanks.

    1. David leitch Avatar
      David leitch

      Its harder to type “/” than space. To me a space or even $xMWh the “/” its implied by the context. However I take your point.

      1. Ray Miller Avatar
        Ray Miller

        David added to this is the mixed mode of dealing with energy in general, in your report on energy, the Gas market (Joules) and Electricity (Watt hours) makes comparison difficult. I think it is about time we used ONE common unit so direct comparisons can be done in any analysis. As an aside this even gets worse when we all buy fuel for our transport with it sold by the litre so no one has any idea of the amount of energy let alone the price per Joule! This is an absurd situation, it is either a conspiracy or the more rational reason is society is so dumb and do not want to know.
        Why does this matter? A Joule is a Joule is a Joule, I think it would be a powerful change to give all citizens the ability to understand more about the energy we are all using and empowering us to use the new found perspective to not only make better decisions but have a chance of aiding the energy transmission we need to make.

        1. David leitch Avatar
          David leitch

          You should try LNG. Tons, Petajoules, TCF, MMBTU, MCM are all in use. I will continue to use MW for power MWh for electricity energy, Giga, Tera and Peta joules for gas and pick and choose for LNG. Cheers

          1. Jonathan Prendergast Avatar
            Jonathan Prendergast

            Not to mention c/kWh used typically in the relationship between customers and retailers.

  3. Jonathan Prendergast Avatar
    Jonathan Prendergast

    Thanks for your analysis and insightful commentary as always David. Agree the price rise will see more customers become pro-active.

    I like the FY18 Futures column graph, as it shows how much as changed. Wondering if you do it in the future, the growth could go left-right? Gee, bunch of pedantic needy experts around here!

Get up to 3 quotes from pre-vetted solar (and battery) installers.