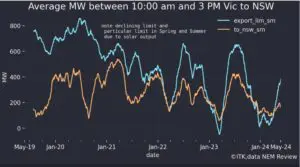
The general consensus in the electricity industry is that the 10 per cent increase in new solar and wind supply, particularly as its zero marginal cost, coupled with flat demand will result in a fall in electricity prices. However for the 30 days ended Jan 18, 2019 that wasn’t true. Pool prices were higher than PCP in NSW, QLD and Victoria. On average prices were higher not just overall but for every half hour.
ITK’s conclusion is that prices have stayed up partly because QLD coal generators have reduced output in the middle of the day rather than shift the power to NSW, partly because NSW coal generators have marginally reduced output in this period – and probably because gas prices are higher.
Gas and hydro generation are down, particularly gas in Queensland and hydro in Victoria, but the reduction hasn’t been enough to reduce prices.
Other than in NSW, demand has been flat over the 30 day period studied. The increase in NSW demand has also likely contributed to the higher prices.
As the year goes on the influence of weather on NSW demand will decline and supply in all states will continue to increase. This should lead to lower prices, but it’s always interesting to check that theory against what’s actually happening. It does seem very clear that the transmission link to Qld is of vital importance to NSW electricity consumers.
I apologise in advance that charts in this note all look the same. So unless you are interested in electricity prices it’s going to be boring. I further apologise for excluding South Australia and Tasmania in this first-glance approach. Queensland time of day is the horizontal axis on all the figures here.
Prices first.


Peak-hour spot prices are $40/MWh higher than PCP in NSW, basically just a touch up in QLD and also well up in Victoria. Since we know supply has increased, the obvious explanation is that, for instance, hotter weather has caused a jump in demand. However that is true only for NSW. Demand in QLD has fallen. The demand numbers exclude rooftop solar demand and also exclude rooftop solar supply.

NSW demand has increased in the middle of the day this year for this 30 days. NSW has high-cost coal generation and in the middle of the day through to early evening relies on imports to make up supply. We think its those imports are driving up prices across the NEM.

Queensland demand has fallen but the fall around 5-6 PM was small relative to the increase in demand in NSW.

Victorian demand has not changed significantly.
Not enough change in demand to explain the price increases
We don’t think there is enough of a demand change to explain the price increase. Consider the 1 PM to 1:30 PM interval which we summarize below:

Our understanding of this is that QLD producers are requiring a big price premium to ship power down to NSW, bigger than we would have thought necessary.
Our theory is that QLD gas producers would reduce output first as new solar comes on in Qld and then any remaining surplus is shifted to NSW. However this turns out to be only partly correct so far.
To test this it’s easy enough to look at generation by fuel, a familiar piece of work.