This report is being published in front of the detail of the Federal Government’s energy plan. Detail matters so we defer comment. It seems very clear though that energy policy, like so many things, will remain a political battleground.
The electricity industry, broadly speaking industry and business in general, and the public would have loved a bipartisan approach where politicians could have agreed on a national policy and set about achieving it in the best Australian traditions.
Instead we are going to get the coal and renewable lobbies continuing to duke it out with electricity prices and lack of investment as collateral damage. States will be forced into their own schemes and these are not without political risk.
Still if we are going to have a fight its nice to know that your on the winning side. Physics, in the form of global warming, will continue to gradually push decarbonization to the top of the policy agenda.
Leaving aside politics the key question will be the impact the policy has on new investment….
Turning to the weekly action
- Volumes:. Were down 1% this week driven by a sharp decline in Victoria and despite a 3% increase in Qld. Again we see weather as the main driver.
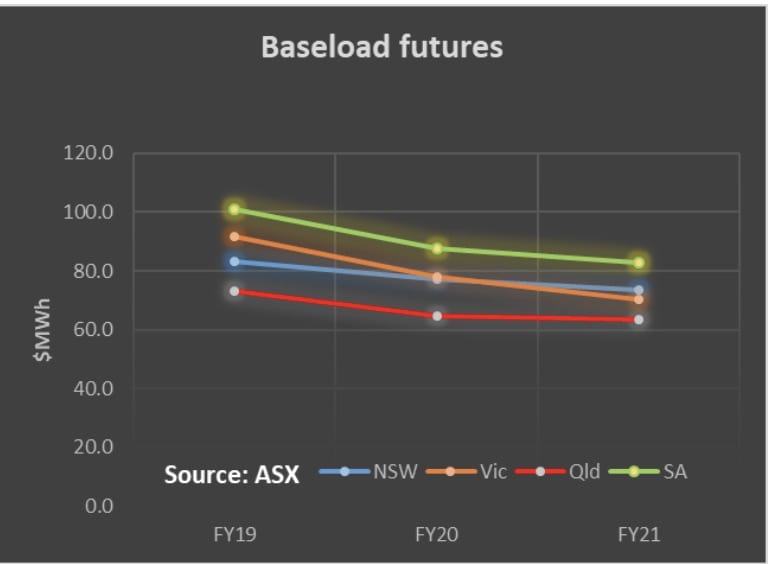
- Future prices showed little trend movement, down in NSW, possibly reflecting Springvale coal legislation, up in Qld and Sth Australia
- Spot electricity prices averaged around the $70 MWh mark in the Southern States but were over $100 MWh in QLD. Its interesting to understand whether it’s the rain (reducing rooftop PV) or higher temperatures. If time permits we’ll have a look at the recent output of the coal generators in QLD next week.
- REC. prices fell a touch. It appears there will be no replacement for the LRET target. Uncontracted wind & PV generators will be thinking hard about what this means for them.
Gas prices rose last week to $9.0 GJ in QLD and $6.8 GJ in NSW, about 5-8% above last year.
Utility share prices. Mostly rose during the week as did the broader index. However the more renewable and smaller utility names did worse with Windlab, and Tilt falling

Share Prices


Volumes

Base Load Futures, $MWH


Gas Prices


