Whats interesting this week – Climbing a wall of worry
I did plan to do an update on overseas shares of wind & solar PV to point out how low the share of wind & PV in the NEM still is relative to many other regions in the world.
And then to go on and show that in the rest of the world, or should that be the real world, regions with a progressive approach to integrating renewables are not seeing reliability problems.
The grids I’m talking about are Europe, and its sub grids, California, and Texas. I may still do that note, but it’s on hold because ERCOT, the independent system operator in Texas, and the main source of electricity information about the site, is no longer allowing access to its public website from computers not located in the USA…….. :-%@*** or in facebook jargon “WTF” . So I’m in the process of applying for an exception and in a holding pattern.
Meantime. The following table simply shows the wind & PV market share across the NEM as a whole and by State for the 7 months since Hazelwood closed. Wind & solar PV are 54% of demand in South Australia and the grid is still functioning.
Recall that in many ways South Australia is a bad place to run a high renewables share grid because its interconnector links are poor, and it has no hydro resource at all.
Across the NEM the wind & PV share is now 12%, still well below many other major grids around the world.

Of course as we know there are still something over 4 GW of new utility renewables to come on line but other than in Queensland I doubt they will move the average price dial that much. More is need in Victoria. That’s the State that has to replace Hazelwood and so far there clearly is not enough new renewables in Victoria to do that.
Turning to the weekly action
The only weekly action of note this week was the soft demand in South Australia & Victoria, down 8% and 10% in year on year terms.
Whether that was weather related or partly the car industry, small in absolute terms, but meaningful in year on year changes for a week, is not known. There was also a fractional movement in REC prices but just theoretical.

Share Prices


Volumes

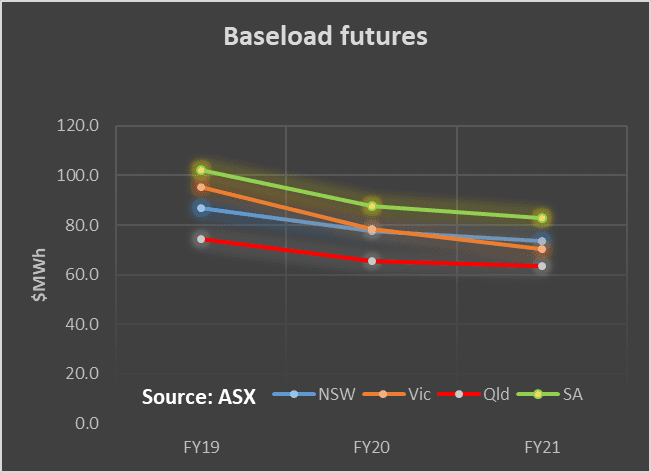
Base Load Futures


Gas Prices


David Leitch is principal of ITK. He was formerly a Utility Analyst for leading investment banks over the past 30 years. The views expressed are his own. Please note our new section, Energy Markets, which will include analysis from Leitch on the energy markets and broader energy issues. And also note our live generation widget, and the APVI solar contribution.


