It’s spring time: The garden’s beautiful and wholesale electricity prices on Australia’s National Electricity Market are volatile.
Global Roam, via NEM Review, lets me look at the electricity market in glorious detail. It shows generation, FCAS, demand price by region and by half hour. Its an endless treasure trove for an analyst.
Yes, there are better and more important things to do, but any analyst worth their salt loves to look at the freshest data. And, as ridiculous as it sounds, watching the little worm move on your favourite graph over months and years is an actual pleasure. Almost like reading a top Joe Aston column.
So what’s up in Spring 2021?
Figure 1 shows the daily shape of electricity prices in the past 14 days in Queensland and Victoria.

The average wholesale price for Queensland is $47/MWh and for Victoria it is $25/MWh. The interesting thing to me is that Victorian prices are lower than Queensland, despite having less of the midday solar impact.
Essentially, Victorian generation has less pricing power in the peak demand time of day. The reasons for this are interesting and merit a longer discussion than I have time for here.
The next point is that prices are consistently negative in the middle of the day. Consistently. And there is every likelihood this will become more pronounced out to the end of November and more pronounced next year.
Except they won’t. That’s because prices are self correcting. Negative prices are a dirty big price signal. And history proves that someone won’t be able to resist that juicy, juicy apple.
They will bite into its sweet taste – most likely with storage – and eventually prices will go up again. That’s for the future. Right now we can look at the spreads on offer.
Here at ITK we are fascinated by spreads of all sorts, but particularly pool prices spreads and how they change over the seasons. It’s simple to calculate: just subtract the lowest price from the highest to get the best half hourly spread, the highest two from the lowest two for the 1 hour spread, and so on. It assumes perfect foresight, and a 100% round trip efficiency, and no impact from market actors.
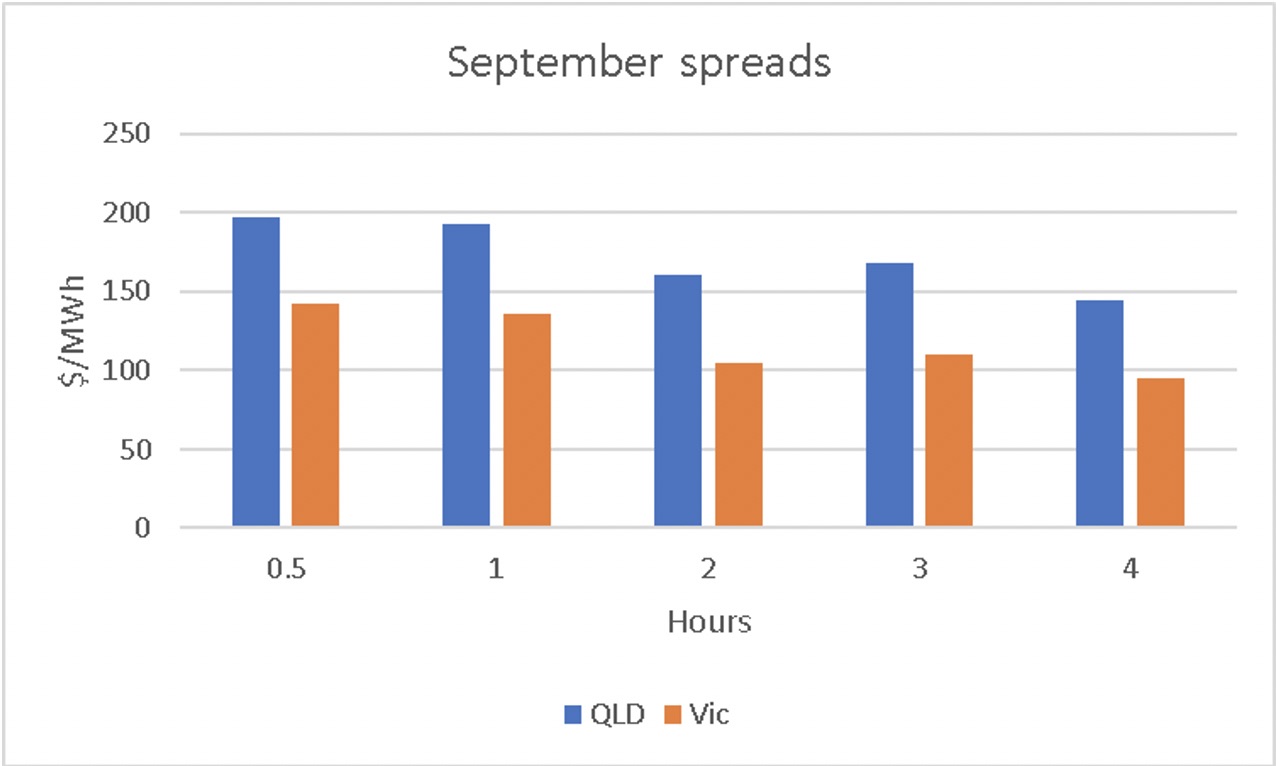
Queensland has a good spread right now. A spread of more than $100 for many hours clearly is something a battery can make money out of. I’d like to be talking about Doosan Tech and the Vena Big Battery as the new brand on the street, but that to will have to wait.
So, turning to the negative side of things, how does coal go in such market conditions?
Well, clearly it’s having to ramp up and down, and I include NSW here because right now NSW is the ramp champ.

To put the picture into words via a table, and only my fellow analysts will appreciate the beauty of a good table … the message in a bottle, so to speak.
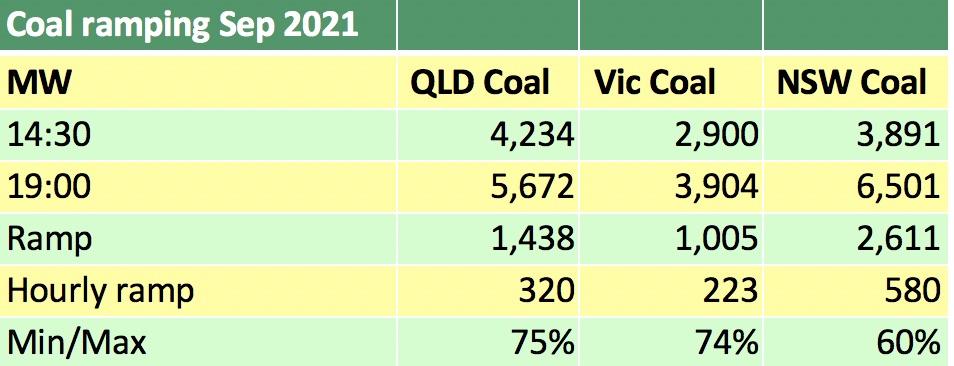
Victorian coal is already ramping more than it probably wants to. Next time round I’ll check the individual units, I have my guesses as to which ones but not the time to confirm.
NSW coal is going down to 60% of its peak every day. For NSW units and the system in general this has to increase wear and tear.
Sure, the NSW ones have governors and auxiliaries that make this achievable, but is it great for the life of the generators? Will boilers be more subject to fatigue?
I am guessing so, but better to ask a thermo dynamic specialist. Also, I have to imagine that efficiency at the low end of the operating range is not all that good.
But there are also big bad revenue implications. In general, total costs of brown coal generators are probably over $25/MWh (that is fixed operating costs, maintenance capex and implied finance costs, although the finance costs don’t go away even if you close, and you bring forward remediation).
The NSW 6300 kcal coal cost is around a record A$240/t. No NSW generator actually pays that, because they burn lower quality coal and have contracts, although some are only short term.
But if a NSW generator had to buy at spot, the implied cost works out to about $86/MWh. And, again, if we chase a rat up a drainpipe, this is ultimately why China’s coal generation is screwed. But let’s not chase the rat.
The point, and not being a Barnaby, there is one: In the two weeks covered about 11,000MW of coal is earning negative pool revenue between 10:00 AM and 1:30 PM.
They make up for that by running harder during peak times at peak prices, so coal generation gets close to average pool prices, but it isn’t much fun consistently running at a loss in the middle of the day.