What is transmission worth? It’s not an existential question, but certainly in Australia’s energy transition it is a recurring and important question.
An interesting recent article in RenewEconomy by ITK’s David Leitch drew attention to a chart of the prices of 2023 Baseload futures contracts (i.e. contracts for the supply of 1MW of electricity for every hour in 2023) in New South Wales (NSW) and Victoria (VIC).
The chart showed that over the last year, the futures market says that the gap between the average 2023 price in VIC and NSW has widened from about $10/MWh (what the market expected the gap to be in 2021) to about $35/MWh (what the market is expecting now).
In the article, David suggested this was evidence of an “damning indictment” of transmission planning in the NEM.
This is interesting because it examines information from the market, and because it considers the economic value of interconnection as represented by the differences in the prices between markets.
Price differences between the regional markets of the National Electricity Market arise for many reasons, but mostly because it costs more to produce electricity in one market than in the other and there are physical limits in the ability to move electricity between regional markets.
Increasing transfers between the NEM’s regional markets can sometimes be done cheaply, for example through better power system or network operation or by adding batteries – such as the Victoria Big Battery. But big increments of capacity are expensive.
For example, Marinus Link, a proposal to add two 750MW cables between VIC and Tasmania is estimated to cost $3.6 billion. To put that number into perspective, it is about 3.5 times the entire regulated asset value of all the transmission lines in the whole of Tasmania (TAS).
Price differences alone can not sustain a conclusion of “damning indictment”. We need to look at costs and price differences – if reducing price differences costs more than those differences, then there is no indictment to be found in failing to reduce those differences.
Or, to put it more succinctly by channelling the essential idea underlying Oscar Wilde’s criticism of capitalists, “they know the price of everything but the value of nothing”.
In this note we examine whether Marinus Link, and the existing 500MW Basslink cable between Tasmania and Victoria are evidence of an indictment of transmission planning.
Basslink
The Basslink cable was built in 2004. It cost $750 million to build and when it was commissioned was one of the longest high voltage sub-sea electricity cables in the world.
Measured half-hourly over the six-and-a-bit years from the start of 2016 to the end of January this year, there was a maximum flow of 588MW from Tasmania to VIC on Basslink. The average was 109MW.
In the opposite direction there was a maximum of 478MW and the average was 111MW. This gives utilisation rates of 19% when flowing from TAS to VIC and 23% when flowing from VIC to TAS. On average, it was 22%.
Utilisation rates are critical to the economics of transmission, because the bulk of the cost of transmission is the capital outlay: operating costs are a much smaller proportion of total costs in electricity transmission. So, if the utilisation is higher, then average prices are lower and vice versa.
Basslink cost $750 million and, if we assume a 6% cost of capital and that operating and maintenance costs are 20% of total costs, we then we get to an average cost of Basslink (assuming a 50-year life) of $59/MWh. This is a “text book” estimate that we might expect had Basslink been efficiently developed.
In actual fact, as John Lawrence sets out carefully, the annual charge that Hydro Tasmania pays Basslink Pty Ltd is $125 million. This is more than twice the “text book” estimate. The difference reflects the impact, inter alia, of a poorly negotiated interest rate hedge when the cable was financed. Nevertheless, for argument’s sake let’s ignore the real world and persist with the “text book” estimate of Basslink’s average cost.
What does the average cost mean in understanding the profitability of Basslink? It means that, on average, generators in the exporting market (VIC to TAS at some times and TAS to VIC at others) must be willing to sell electricity to customers in the importing market at a price that is least $59/MWh on average cheaper than generators in the importing market. If this is not the case, then it would be better to have not built the interconnector.
So, let’s see what the price differences were when Basslink was flowing one way or the other. To get a sense of things, the chart below shows the median price (over the period from 2016 to now) in each of the NEM’s five regions. From this we can see similar prices in most regions. TAS is a slight outlier – typically a bit more expensive in most hours except the evening peak where it is a lot lower.
Analysing these we find that, since 2016, the difference in the price in VIC and TAS was $20/MWh when power flowed from VIC to TAS, and $44/MWh when power flowed from TAS to VIC giving an average of $32/MWh. This is around half the $59/MWh needed to ensure that Basslink is able to attract sufficient revenues to cover its costs. In other words, the cost of Basslink has far exceeded the value of the trade it has made possible.
In the chart below we have analysed the average hourly price differences over the day between Victoria and Tasmania (i.e. TAS price minus VIC price) over the period since the start of 2016. Negative prices occur typically when VIC is importing from TAS and vice versa for positive prices.
The chart below presents some statistics on the difference between the TAS and VIC wholesale prices in different hours of the day. The khaki line is the average. From this we can see that the VIC price, on average, is very similar to the TAS price, except in the afternoon from about 4pm to 9pm.
But for only one hour in the day (6pm) is the price difference equal to the average cost of Basslink. The price difference in all hours never exceeds the average cost of Basslink, and in most hours is much less than the average cost of Basslink. In fact the median price difference is negligibly small in all hours.
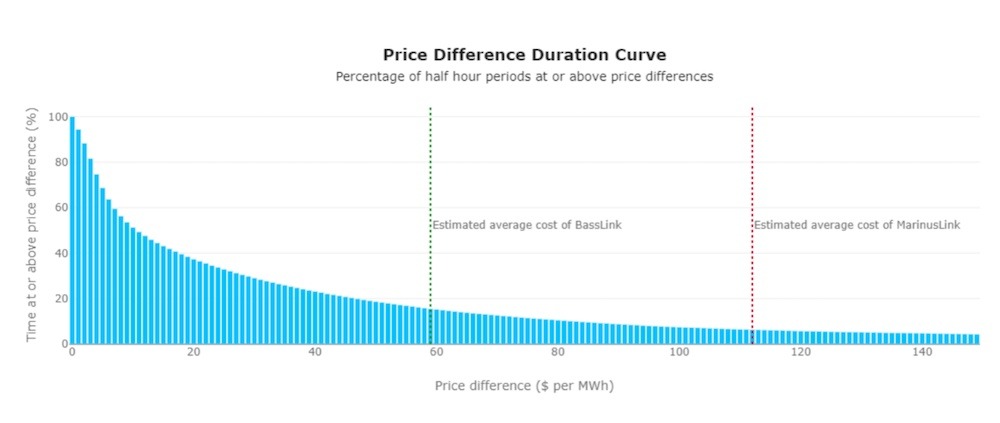
Another way of cutting the numbers is the price difference “duration curve” (below). This ranks the half-hourly price differences from highest to lowest and then shows the percentage of half-hours over the six-and-a-bit years since 1 January 2016 that that price difference on the x-axis has occurred. On the chart we show again the average cost of Basslink and Marinus Link (the green and red dotted lines).
For Basslink we can see that the price differences were higher than the average cost of Basslink for just 17% of all half-hours. In the case of Marinus Link, in just 8% of all half hours has the price difference exceeded its expected average cost.
In a previous life I (Bruce, one of the co-authors of this piece) ) was a member of the team that provided market advice to Cityspring (part of Temasek) when they decided to buy Basslink from National Grid, in 2006. I could not possibly repeat my advice here, but I can say that it is no surprise to me that if they were given half a chance, Hydro Tasmania would tear up the Basslink Services Agreement.
As we have shown, it is paying far more in fees that it was getting in revenue from trading over the interconnector. Indeed this is exactly what Hydro Tasmania has recently done, when given that half a chance.
Marinus Link
What about the economics of Marinus Link? Let’s consider, first, the value and then the cost.
The value of Victoria and Tasmania to each other (in electricity trade) is primarily a function of the dynamics of Victoria’s thermal power system with its low marginal cost but inflexible coal generators, and the hydro-based Tasmanian power system (with its flexible, seasonal but reasonably storable energy).
The value of this trade will almost certainly decrease in future as coal generation is replaced by variable renewable generation (there will be many hours when TAS and VIC has zero marginal cost generation setting prices). Furthermore the value of Tasmania’s storage will decrease in future as VIC develops its own (chemical battery) storage capacity.
Yet for Marinus to be viable it requires exactly the opposite: that the storage in Tasmania will be more valuable in future than in the past. In fact, looking at the price duration curve or hourly price difference charts we showed earlier, it is obvious that trade needs to be much more valuable in future than it has been in the past, in order to justify Marinus.
The reason for this is that the cost of Marinus Link, per MW, is about twice the cost of Basslink. Marinus is expected to cost about $3m per MW, while Basslink cost $1.5m per MW.
Specifically, doing the same sums that we did earlier but this time using Marinus’ projected cost ($3.6bn) and its stated capacity (1.5GW) we calculate that the average price of Marinus assuming a 25% capacity factor is now $112/MWh – about double the average cost of Basslink.
Bringing together the expectation of lower value and much higher cost, it follows that Marinus has much less chance of covering its cost than Basslink. In numbers, the average price difference between VIC and TAS would need to rise by a factor of nearly four from $32/MWh to $112/MWh for Marinus to have a hope of earning sufficient revenue to cover its costs.
Nonetheless, AEMO has concluded that Marinus will deliver big net benefits. Why? We examined this in detail in our submission to AEMO’s Draft ISP.
In summary, AEMO assumes that 1,900MW of wind generation will be built in Tasmania even if Marinus Link is not developed. This is not realistic, even the Tasmanian energy minister says so. Once we correct AEMO’s mistake, the benefits do not exceed the costs on AEMO’s analysis and its data comes to the same conclusion that we have here.
So are Basslink and Marinus Link evidence of an “indictment” in transmission planning? Yes. It is surely a “damning indictment” that, even with the experience of Basslink, the powers-that-be want to triple the interconnection with a new cable that is twice as expensive per MW than the existing interconnector, considering that the existing interconnector has been such an abject failure.
The Tasmanian government has, however, learned from its past mistakes in some ways: this time it wants to impose the cost of the link on electricity consumers and tax- payers in Tasmania, Victoria and other states, not just on Tasmania’s tax-payers and electricity consumers.
Finally, in a previous article we briefly examined the implications of the Victorian government’s policy to establish a 9GW (by 2040) offshore wind generation target, that the Premier of Victoria has committed to “meeting and exceeding”.
We concluded in that note that AEMO will now have to re-do its Integrated System Plan, considering that it made no allowance for offshore wind generation in its Step Change (most likely) scenario.
This provides an opportunity for AEMO to look again at how it has analysed Marinus Link and the development of the power system in Tasmania, with and without Marinus Link. It should take the opportunity.
Professor Bruce Mountain is the Director of the Victoria Energy Policy Centre (VEPC). Ben Willey is a mathematician and data scientist at VEPC


