Is China doing more to tackle climate change than the US and EU? A new analysis into the impact of its recently announced coal caps suggest it may – at least by some measures.
The latest report from the UN IPCC’s third working group into climate change showed global emissions rising fast over the past decade – largely driven by emissions from coal plants in emerging economies, especially China.
But emissions in the west have also fallen relatively little and China’s plans – driven in large part by the spread of air pollution across the country – could lead to a far more significant change in the global emissions trajectory.
China as a whole has not committed to absolute CO2 emission reductions like the EU and US – but it does look like it will act far more quickly than these industrialised countries and make a much more significant change compared to what would have happened without action. Many of the high income provinces with highest CO2 emissions are also targeting absolute reductions in their coal use, by far the dominant source of CO2 in China.
All of that depends – of course – on China’s coal caps being adhered to and on new projects in uncapped regions not nullifying a significant part of their impact.
Kyoto protocol
Under the Kyoto Protocol, agreed in 1997, industrialised countries committed to reducing their overall emissions by 5.2% below 1990 levels by 2008-2012.
This implies a reduction of about 190 million tonnes of CO2 from 1996 to 2010 – a period of 14 years. In terms of overall required emission reductions, this is miniscule. It is explained by the fact that the targets overall were modest, and former Soviet bloc countries were allowed to increase their overall emissions from 1996.
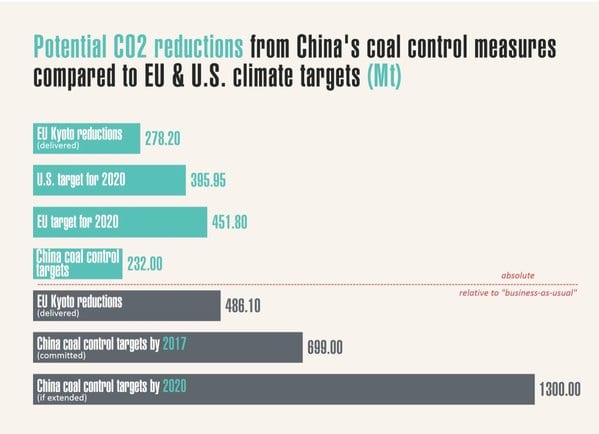
The European Union committed to, and delivered, a 280 million tonne reduction in emissions from 1996 levels by 2010. The EU’s emission reduction target for 2020 amounts to 450 million tonnes, or 12% compared to 2010 levels. The United States is aiming for a 400 million tonne, or 7%, reduction from 2009 to 2020.
As a whole, China continues to increase coal use and emissions, but its leading provinces are already outdoing industrialised countries in terms of achieving absolute reduction commitments, and this is also resulting in significantly slower CO2 emission growth on the national level.
 The coal reduction targets in twelve Chinese provinces alone amount to a reduction of 230 million tonnes of CO2, or 10% of CO2 emissions, from 2012 to 2017. This is equivalent to the annual CO2 emissions of countries such as the Netherlands or Malaysia.
The Chinese provinces that are now committed to reducing their use of coal by 2017 experienced rapid growth in coal consumption up to 2011. It is therefore worthwhile to also assess and compare emissions reductions as reductions from a “business-as-usual” path.
Change to ‘business as usual’
Compared to an assumed business-as-usual growth (estimated by extending past trends), the EU’s Kyoto effort could amount to a maximum reduction of 490 million tonnes of CO2 over a period of 14 years.
For the entire group of industrialised countries under the Kyoto Protocol, including the US, the reduction from business-as-usual would amount to around 800 million tonnes. At the time that they embarked on this effort in 1996, industrialised countries’ total emissions stood at about 17 Gt.
Estimated in the same way, China’s measures to reduce coal consumption would amount to a reduction in CO2 emissions of 700 million tonne over a period of five years below business-as-usual, equivalent to the combined total emissions of Poland and France (see chart above)
More rapid changes
When China embarks on this effort, its emissions are about 10 Gt. If China’s coal control policies are extended into the period of 2018 to 2020, the potential reduction in annual CO2 emissions, compared to business-as-usual, amounts to 1,300 million tonnes over the eight year period from 2012 to 2020, roughly equivalent to the combined total CO2 emissions of the EU’s two largest emitters, Germany and the UK.

As the CO2 emissions of the Chinese provinces covered by the measures are smaller than those of the EU or the U.S., and their reductions are targeted over a much shorter period of time, the annual rates of CO2 reduction required to meet China’s coal control targets are substantially more rapid than those achieved or targeted by industrialised countries, as shown in the Figure 6b.
How the data was calculated: All data for CO2 emissions in this section are based on PBL 2013: Trends in global CO2 emissions: 2013 report. emission data for Chinese provinces from 2006 to 2012 is calculated from National Bureau of Statistics’ China Energy Statistical Yearbooks 2008 to 2013. All “business-as-usual” projections for Chinese provinces assume a 1/3 reduction in growth rates compared with this period, in line with the lower GDP growth target of the 12th five-year plan. No slowdown is assumed for industrialised country projections.