The so-called boom in solar PV has been one of the most defining developments in the energy industry in the last five years. But it has only just begun.
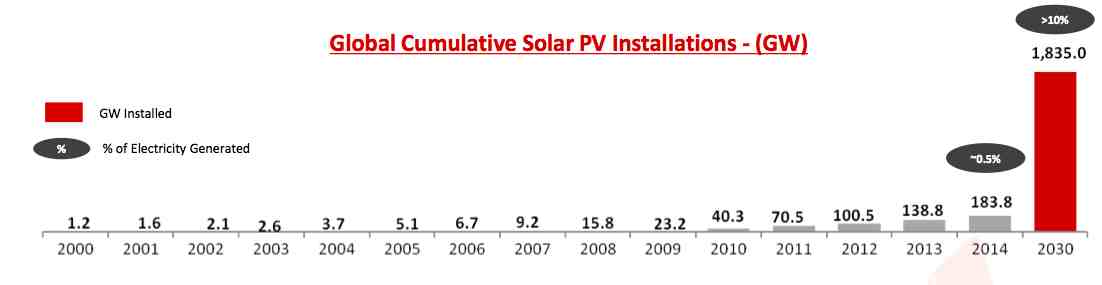
As this graph – taken from a recent presentation from Canadian Solar shows- it is just a scratch on the surface of the global energy industry, accounting for just 0.5 per cent of electricity generated in 2014, even with 183,000MW of solar PV installed.
But over the next 15 years, the market for solar PV will grow 10 times again, with accumulated capacity jumping to 1,835,000MW, according to Canadian Solar. That will account for more than 10 per cent of total electricity generated across the globe. (Please click on graph to enlarge).

In some countries, solar PV is already accounting for more substantial percentages – Italy 9 per cent and Germany 5.3 per cent are the standouts. The 3.6GW capacity in Australia looks six months out of date, and others have estimated the contribution of Australia’s 4.2GW of rooftop solar at more than 2 per cent (in Australia self consumption is not metered, which may explain the discrepancy).

This third graph shows the estimated growth in annual installations over the next eight years, with the biggest country markets over the next five. China will emerge as the dominant market, closely followed by Japan and the US, with India and then Germany.