Today’s graph of the day comes courtesy of research from Cornwall Insight Australia, which took a look at how the growing amounts of wind and solar generation have changed the shape of the energy market in Australia, at least in terms of prices.
The graph shows that the spot market in the country’s biggest electricity market, NSW, over the last financial year has dropped by an average of 15 to 39 per cent – courtesy of increased solar generation from both large scale and rooftop installations, while prices between 4.30pm and 6pm have increased by 10 to 40 per cent.
 “The merchant market in New South Wales (NSW) – and all mainland states are undergoing significant change,” analyst Lumi Adisa writes.
“These daytime price troughs, while driven by increased (rooftop/grid) solar penetration, are beginning to create a clear divergence in the merchant fortunes of both solar and wind technologies.”
Her research shows that solar delivers its peak volumes between 11 AM-1 PM in the bottom quartile of prices. In contrast, wind on average delivers its lowest volumes in this quartile. And then the situation flips towards the evening.
“This variability in peak generation for both technologies is establishing a different outlook for the technologies, creating new opportunities for developers,” she says, noting the opportunities that present for hybrid wind and solar projects, with and without storage.
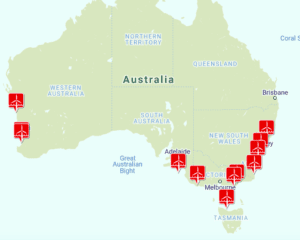
Some notable hybrid projects have already emerged in NSW and in W.A, with the biggest in the country – 320MW – to be built in South Australia by Iberdrola and DP Energy.
“These shapes could also create opportunities for collaborative models through which solar and wind developers can sell their output with reduced firming requirements,” Adisa notes.